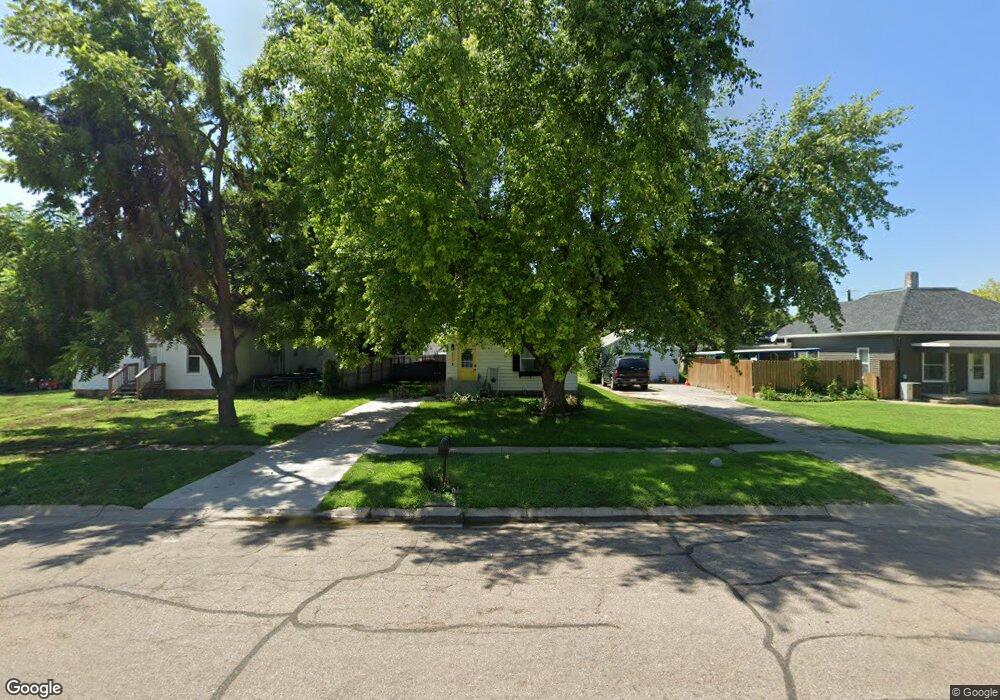
421 N Tyler St Elm Creek, NE 68836
Estimated Value: $129,659 - $178,000
2
Beds
1
Bath
1,120
Sq Ft
$136/Sq Ft
Est. Value
About This Home
This home is located at 421 N Tyler St, Elm Creek, NE 68836 and is currently estimated at $151,915, approximately $135 per square foot. 421 N Tyler St is a home located in Buffalo County with nearby schools including Elm Creek Elementary School and Elm Creek High School.
Ownership History
Date
Name
Owned For
Owner Type
Purchase Details
Closed on
Jan 7, 2016
Sold by
Miller Jennifer L and Martindale Jennifer L
Bought by
Smith Jill M
Current Estimated Value
Purchase Details
Closed on
Dec 17, 2015
Sold by
Miller Jennifer L and Martindale Jennifer L
Bought by
Smith Jill M
Create a Home Valuation Report for This Property
The Home Valuation Report is an in-depth analysis detailing your home's value as well as a comparison with similar homes in the area
Home Values in the Area
Average Home Value in this Area
Purchase History
| Date | Buyer | Sale Price | Title Company |
|---|---|---|---|
| Smith Jill M | -- | Attorney | |
| Smith Jill M | -- | Attorney |
Source: Public Records
Tax History Compared to Growth
Tax History
| Year | Tax Paid | Tax Assessment Tax Assessment Total Assessment is a certain percentage of the fair market value that is determined by local assessors to be the total taxable value of land and additions on the property. | Land | Improvement |
|---|---|---|---|---|
| 2025 | $1,523 | $109,365 | $11,195 | $98,170 |
| 2024 | $1,523 | $96,500 | $11,195 | $85,305 |
| 2023 | $1,795 | $96,725 | $11,195 | $85,530 |
| 2022 | $1,327 | $68,455 | $11,195 | $57,260 |
| 2021 | $1,259 | $65,830 | $11,195 | $54,635 |
| 2020 | $1,225 | $64,485 | $11,195 | $53,290 |
| 2019 | $1,138 | $60,285 | $11,195 | $49,090 |
| 2018 | $1,052 | $59,635 | $11,195 | $48,440 |
| 2017 | $967 | $55,325 | $11,195 | $44,130 |
| 2016 | $1,068 | $62,270 | $11,195 | $51,075 |
| 2015 | $568 | $30,285 | $0 | $0 |
| 2014 | $701 | $33,955 | $0 | $0 |
Source: Public Records
Map
Nearby Homes
- 414 N Mill St
- 74769 L Rd
- Odess Unit a NE 68861
- Lot M Eagle Ridge
- Eagle Ridge Tbd Lot A
- 11 Acres
- 45 acres Eagle Ridge Lot P
- 5690 Standage Place
- 6195 Standage Place
- Lot J Eagle Ridge
- 205 9th St
- 912 B St
- 709 Lincoln St
- 85th W Evergreen
- 16560 Amherst Rd
- Tract 8 Evergreen Rd
- 7800 Hidden Hills Rd
- 10250 190th Rd
- 4710 Dove Hill Ave
- 4280 72nd Avenue Place
- 431 N Tyler St
- 413 N Tyler St
- 110 E Boyd Ave
- 435 N Tyler St
- 432 N Tyler St
- 120 E Boyd Ave
- 335 N Tyler St
- 121 W Boyd Ave
- 443 N Tyler St
- 340 N Tyler St
- 130 E Boyd Ave
- 440 N Tyler St
- 132 W Boyd Ave
- 420 N Church St
- 131 W Elm Ave
- 331 N Tyler St
- 240 N Church St
- 425 N Beecroft St
- 432 N Church St
- 401 N Beecroft St