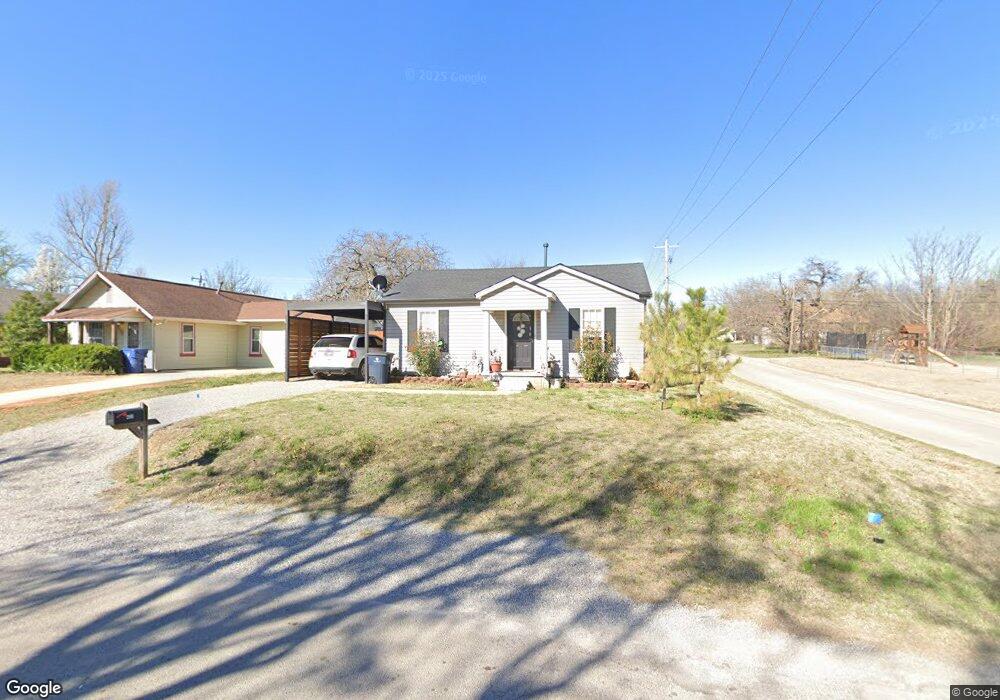
421 N Van Buren Ave Blanchard, OK 73010
Estimated Value: $160,000 - $174,000
3
Beds
2
Baths
1,080
Sq Ft
$156/Sq Ft
Est. Value
About This Home
This home is located at 421 N Van Buren Ave, Blanchard, OK 73010 and is currently estimated at $168,347, approximately $155 per square foot. 421 N Van Buren Ave is a home located in McClain County with nearby schools including Blanchard Elementary School, Blanchard Intermediate School, and Blanchard Middle School.
Ownership History
Date
Name
Owned For
Owner Type
Purchase Details
Closed on
Jun 30, 2021
Sold by
Cottrell Bradley A and Cottrell Rebecca Janelle
Bought by
Beaty Linda
Current Estimated Value
Purchase Details
Closed on
Oct 28, 2009
Sold by
Cottrell Alan R and Cottrell Debra
Bought by
Cottrell Bradley A and Cotterell Rebecca Janelle
Home Financials for this Owner
Home Financials are based on the most recent Mortgage that was taken out on this home.
Original Mortgage
$48,979
Interest Rate
5.05%
Mortgage Type
New Conventional
Purchase Details
Closed on
Dec 23, 2008
Sold by
Diamond Properties Investments Llc
Bought by
Black Diamond Llc
Purchase Details
Closed on
Aug 29, 2008
Sold by
U S Bank National Assn
Bought by
Blue Spruce Entities Llc
Create a Home Valuation Report for This Property
The Home Valuation Report is an in-depth analysis detailing your home's value as well as a comparison with similar homes in the area
Home Values in the Area
Average Home Value in this Area
Purchase History
| Date | Buyer | Sale Price | Title Company |
|---|---|---|---|
| Beaty Linda | $145,000 | American Abstract Co Of Mccl | |
| Cottrell Bradley A | $48,000 | None Available | |
| Black Diamond Llc | $5,500 | None Available | |
| Diamond Properties Llc | $5,500 | None Available | |
| Blue Spruce Entities Llc | $4,000 | None Available |
Source: Public Records
Mortgage History
| Date | Status | Borrower | Loan Amount |
|---|---|---|---|
| Previous Owner | Cottrell Bradley A | $48,979 |
Source: Public Records
Tax History Compared to Growth
Tax History
| Year | Tax Paid | Tax Assessment Tax Assessment Total Assessment is a certain percentage of the fair market value that is determined by local assessors to be the total taxable value of land and additions on the property. | Land | Improvement |
|---|---|---|---|---|
| 2025 | $1,595 | $15,950 | $4,398 | $11,552 |
| 2024 | $1,595 | $15,950 | $3,024 | $12,926 |
| 2023 | $1,595 | $15,950 | $3,024 | $12,926 |
| 2022 | $1,597 | $15,950 | $2,749 | $13,201 |
| 2021 | $561 | $4,897 | $770 | $4,127 |
| 2020 | $637 | $4,897 | $770 | $4,127 |
| 2019 | $625 | $4,713 | $770 | $3,943 |
| 2018 | $542 | $4,488 | $770 | $3,718 |
| 2017 | $563 | $4,275 | $770 | $3,505 |
| 2016 | $501 | $4,071 | $770 | $3,301 |
| 2015 | $488 | $3,878 | $770 | $3,108 |
| 2014 | $477 | $3,693 | $770 | $2,923 |
Source: Public Records
Map
Nearby Homes
- 711 N Van Buren Ave
- 721 N Harrison Ave
- 1133 Wild Rye Ct
- 945 Fox Run Ln
- 416 S Harrison Ave
- 448 Highgrove Dr
- 26964 Bridlewood Rd
- 1403 Pecan Dr
- 1621 Silver Oak Dr
- 1692 Appaloosa Dr
- 1527 Fox Run Ln
- 1850 Olivia Ct
- 300 Bailey St
- 255 Megan Ct
- 254 Megan Ct
- 1832 Buckskin Ct
- 1148 Adams Ave
- 609 S County Line Ave
- 1378 Heartwood Dr
- 1074 Fawn Meadow Dr
- 417 N Van Buren Ave
- 413 N Van Buren Ave
- 414 N Van Buren Ave
- 412 N Van Buren Ave
- 410 N Van Buren Ave
- 501 N Van Buren Ave
- 217 4th St
- 418 N Jackson Ave
- 301 5th St
- 502 N Jackson Ave
- 410 N Jackson Ave
- 401 N Van Buren Ave
- 209 NE 4th St
- 509 N Van Buren Ave
- 309 NE 5th St
- 516 N Van Buren Ave
- 402 N Jackson Ave
- 404 N Van Buren Ave
- 216 NE 4th St
- 508 N Van Buren Ave