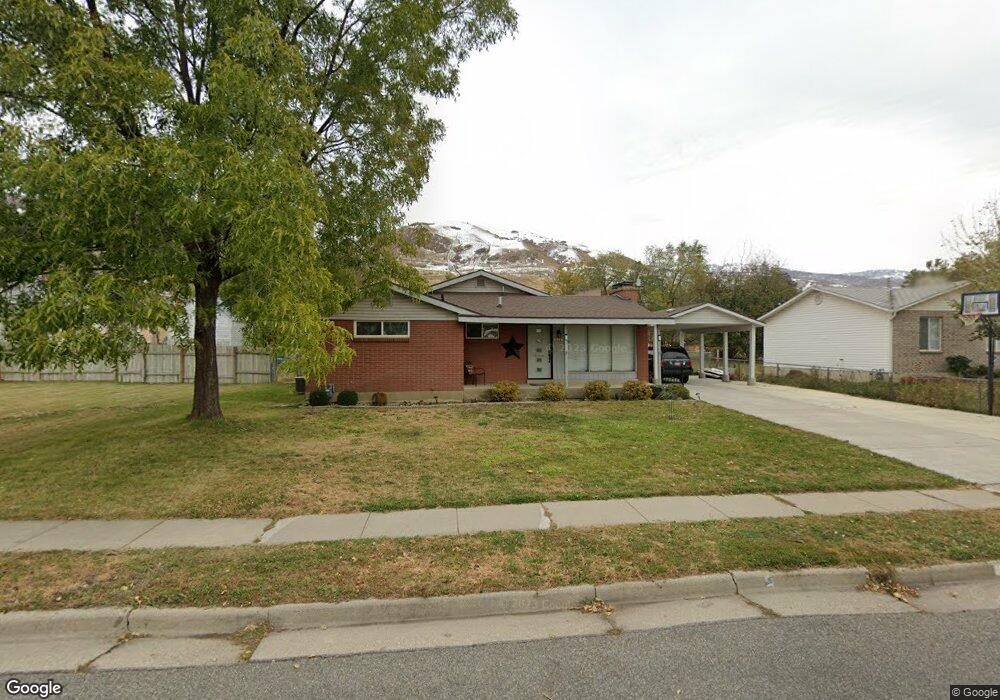
421 S 300 E Centerville, UT 84014
Estimated Value: $487,562 - $550,000
3
Beds
2
Baths
2,219
Sq Ft
$231/Sq Ft
Est. Value
About This Home
This home is located at 421 S 300 E, Centerville, UT 84014 and is currently estimated at $513,391, approximately $231 per square foot. 421 S 300 E is a home located in Davis County with nearby schools including J A Taylor Elementary School, Centerville Jr High, and Viewmont High School.
Ownership History
Date
Name
Owned For
Owner Type
Purchase Details
Closed on
Jan 7, 2021
Sold by
Carter Curtis B
Bought by
Carter Curtis B and Carter Nobuko M
Current Estimated Value
Home Financials for this Owner
Home Financials are based on the most recent Mortgage that was taken out on this home.
Original Mortgage
$191,000
Interest Rate
2.7%
Mortgage Type
New Conventional
Purchase Details
Closed on
Mar 4, 2010
Sold by
Randall Shilrey B
Bought by
Randall Shilrey B
Create a Home Valuation Report for This Property
The Home Valuation Report is an in-depth analysis detailing your home's value as well as a comparison with similar homes in the area
Purchase History
| Date | Buyer | Sale Price | Title Company |
|---|---|---|---|
| Carter Curtis B | -- | Premium Title & Escrow Inc | |
| Randall Shilrey B | -- | None Available |
Source: Public Records
Mortgage History
| Date | Status | Borrower | Loan Amount |
|---|---|---|---|
| Closed | Carter Curtis B | $191,000 |
Source: Public Records
Tax History
| Year | Tax Paid | Tax Assessment Tax Assessment Total Assessment is a certain percentage of the fair market value that is determined by local assessors to be the total taxable value of land and additions on the property. | Land | Improvement |
|---|---|---|---|---|
| 2025 | $2,616 | $250,250 | $165,727 | $84,523 |
| 2024 | $2,521 | $245,300 | $149,530 | $95,770 |
| 2023 | $2,440 | $429,000 | $244,528 | $184,472 |
| 2022 | $2,562 | $248,050 | $123,626 | $124,424 |
| 2021 | $2,334 | $352,000 | $189,486 | $162,514 |
| 2020 | $1,897 | $286,000 | $184,696 | $101,304 |
| 2019 | $1,915 | $282,000 | $183,871 | $98,129 |
| 2018 | $1,780 | $259,000 | $170,547 | $88,453 |
| 2016 | $1,485 | $120,065 | $57,908 | $62,157 |
| 2015 | $1,480 | $112,860 | $57,908 | $54,952 |
| 2014 | $1,556 | $121,443 | $57,908 | $63,535 |
| 2013 | -- | $107,112 | $44,204 | $62,908 |
Source: Public Records
Map
Nearby Homes
- 495 E 475 S
- 150 E 735 S Unit 23
- 328 E 1100 S
- 16 W 780 S
- 360 E Center St
- 967 S Courtyard Ln
- 16 S 200 E
- 610 S 800 E
- 610 E Pages Ln
- 462 Pitford Dr
- 88 W 50 S Unit C-3
- 88 W 50 S Unit B5
- 96 Village Square Rd
- 951 Centerville Commons Way
- 252 N 400 E
- 330 W Paradiso Ln
- 56 W 200 N
- 1420 N Main St
- 380 E 400 N
- 2 S 285 W
Your Personal Tour Guide
Ask me questions while you tour the home.