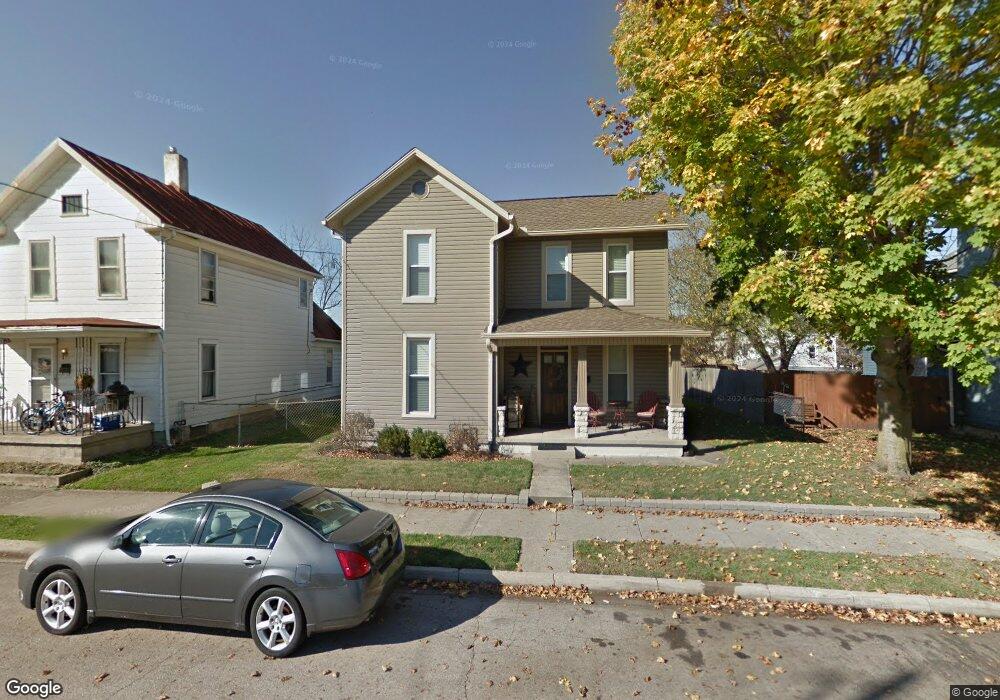
421 S 3rd St Miamisburg, OH 45342
Downtown Miamisburg NeighborhoodEstimated Value: $200,110 - $217,000
3
Beds
1
Bath
1,772
Sq Ft
$118/Sq Ft
Est. Value
About This Home
This home is located at 421 S 3rd St, Miamisburg, OH 45342 and is currently estimated at $208,778, approximately $117 per square foot. 421 S 3rd St is a home located in Montgomery County with nearby schools including Miamisburg High School and Bethel Baptist School.
Ownership History
Date
Name
Owned For
Owner Type
Purchase Details
Closed on
Feb 22, 2016
Sold by
Bellar Mary and Bellar Scott
Bought by
King Frances L
Current Estimated Value
Home Financials for this Owner
Home Financials are based on the most recent Mortgage that was taken out on this home.
Original Mortgage
$83,650
Outstanding Balance
$66,619
Interest Rate
3.92%
Mortgage Type
New Conventional
Estimated Equity
$142,159
Purchase Details
Closed on
Sep 16, 2009
Sold by
Deutsche Bank National Trust Company
Bought by
Bellar Mary and Bellar Scott
Purchase Details
Closed on
Feb 11, 2009
Sold by
Maynard Shawn and Maynard Nichole
Bought by
Deutsche Bank National Trust Company
Purchase Details
Closed on
Aug 21, 2001
Sold by
Flynn John J and Flynn Martha
Bought by
Household Realty Corp
Purchase Details
Closed on
Jun 17, 1994
Sold by
Mcdonald Brian L and Mcdonald Joy L
Bought by
Flynn John J
Create a Home Valuation Report for This Property
The Home Valuation Report is an in-depth analysis detailing your home's value as well as a comparison with similar homes in the area
Home Values in the Area
Average Home Value in this Area
Purchase History
| Date | Buyer | Sale Price | Title Company |
|---|---|---|---|
| King Frances L | $86,300 | Sterling Title Inc | |
| Bellar Mary | $19,900 | Attorney | |
| Deutsche Bank National Trust Company | $43,000 | None Available | |
| Household Realty Corp | $55,000 | -- | |
| Flynn John J | -- | -- |
Source: Public Records
Mortgage History
| Date | Status | Borrower | Loan Amount |
|---|---|---|---|
| Open | King Frances L | $83,650 |
Source: Public Records
Tax History Compared to Growth
Tax History
| Year | Tax Paid | Tax Assessment Tax Assessment Total Assessment is a certain percentage of the fair market value that is determined by local assessors to be the total taxable value of land and additions on the property. | Land | Improvement |
|---|---|---|---|---|
| 2024 | $3,725 | $57,120 | $5,310 | $51,810 |
| 2023 | $3,725 | $57,120 | $5,310 | $51,810 |
| 2022 | $3,089 | $39,670 | $3,690 | $35,980 |
| 2021 | $2,744 | $39,670 | $3,690 | $35,980 |
| 2020 | $2,738 | $39,670 | $3,690 | $35,980 |
| 2019 | $2,440 | $32,260 | $3,690 | $28,570 |
| 2018 | $2,448 | $32,260 | $3,690 | $28,570 |
| 2017 | $2,432 | $32,260 | $3,690 | $28,570 |
| 2016 | $2,468 | $31,590 | $3,690 | $27,900 |
| 2015 | $2,470 | $31,590 | $3,690 | $27,900 |
| 2014 | $2,422 | $31,590 | $3,690 | $27,900 |
| 2012 | -- | $28,910 | $5,420 | $23,490 |
Source: Public Records
Map
Nearby Homes
- 111 Old Main St
- 111 S Main St
- 513 Mound Ave
- 42 S Main St
- 619 Jefferson St
- 805 E Linden Ave
- 460 S 8th St
- 607 E Central Ave
- 736 Park Ave
- 7 N Riverview Ave
- 265 S Riverview Ave
- 740 E Central Ave
- 425 Early Dr W
- 24 S 8th St
- 319 N 1st St
- 555 E Sycamore St
- 801 Fairway Ct
- 625 W Linden Ave
- 15 Beth Ln
- 20 Chris Ln