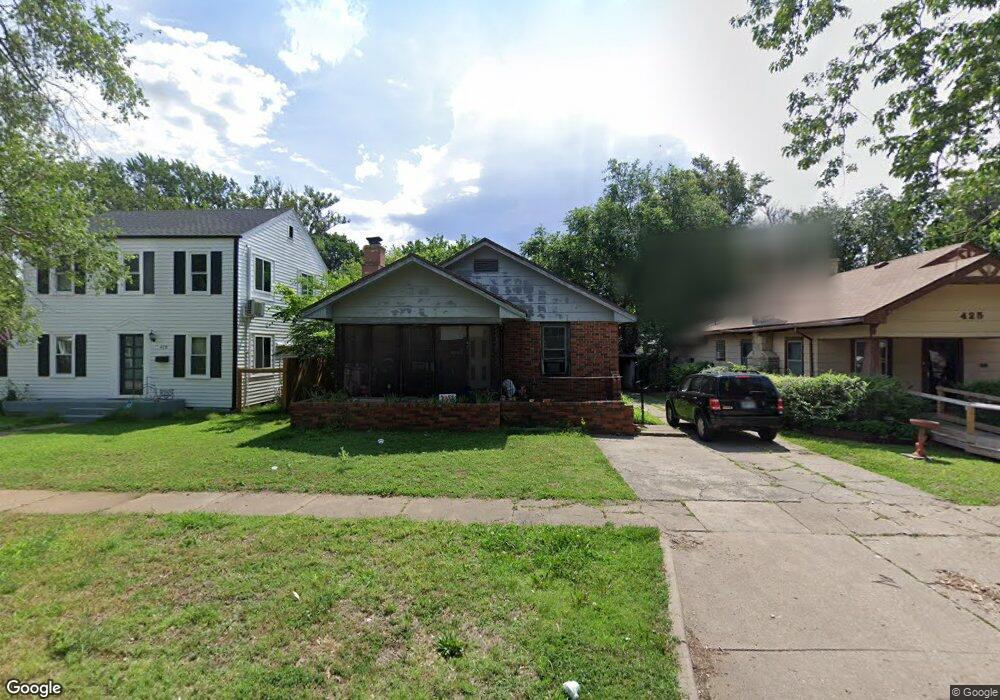
421 S Osage St Ponca City, OK 74601
Estimated Value: $48,000 - $73,000
2
Beds
1
Bath
1,122
Sq Ft
$52/Sq Ft
Est. Value
About This Home
This home is located at 421 S Osage St, Ponca City, OK 74601 and is currently estimated at $58,845, approximately $52 per square foot. 421 S Osage St is a home located in Kay County with nearby schools including Lincoln Elementary School, Ponca City West Middle School, and Ponca City East Middle School.
Ownership History
Date
Name
Owned For
Owner Type
Purchase Details
Closed on
Mar 15, 2010
Sold by
Fry Tamara B and Fry Charles M
Bought by
Luis Heath and Luis Eryn
Current Estimated Value
Purchase Details
Closed on
Feb 8, 2008
Sold by
Luis Heath and Luis Eryn
Bought by
Fry Tamara B
Purchase Details
Closed on
Jun 8, 2005
Sold by
Secretary Of H U D
Bought by
Luis Heath
Home Financials for this Owner
Home Financials are based on the most recent Mortgage that was taken out on this home.
Original Mortgage
$25,667
Interest Rate
5.78%
Mortgage Type
Future Advance Clause Open End Mortgage
Purchase Details
Closed on
Jan 18, 2005
Sold by
Baughman Jeffrey
Bought by
Secretary Of Hud Of Washington D C
Purchase Details
Closed on
Jun 25, 2003
Sold by
Corey Secile and Corey Baughman
Bought by
Jeffrey Baughman
Purchase Details
Closed on
May 17, 2001
Sold by
Shirley Marvin and Shirley Bell
Bought by
Secile Corey and Secile Baughman
Create a Home Valuation Report for This Property
The Home Valuation Report is an in-depth analysis detailing your home's value as well as a comparison with similar homes in the area
Home Values in the Area
Average Home Value in this Area
Purchase History
| Date | Buyer | Sale Price | Title Company |
|---|---|---|---|
| Luis Heath | -- | -- | |
| Fry Tamara B | $42,900 | -- | |
| Luis Heath | -- | -- | |
| Secretary Of Hud Of Washington D C | $34,490 | -- | |
| Jeffrey Baughman | $34,500 | -- | |
| Secile Corey | $35,000 | -- |
Source: Public Records
Mortgage History
| Date | Status | Borrower | Loan Amount |
|---|---|---|---|
| Previous Owner | Luis Heath | $25,667 |
Source: Public Records
Tax History Compared to Growth
Tax History
| Year | Tax Paid | Tax Assessment Tax Assessment Total Assessment is a certain percentage of the fair market value that is determined by local assessors to be the total taxable value of land and additions on the property. | Land | Improvement |
|---|---|---|---|---|
| 2024 | $426 | $4,500 | $308 | $4,192 |
| 2023 | $426 | $4,286 | $308 | $3,978 |
| 2022 | $388 | $4,082 | $308 | $3,774 |
| 2021 | $390 | $4,082 | $308 | $3,774 |
| 2020 | $379 | $4,001 | $308 | $3,693 |
| 2019 | $364 | $3,811 | $308 | $3,503 |
| 2018 | $380 | $3,923 | $308 | $3,615 |
| 2017 | $384 | $3,923 | $308 | $3,615 |
| 2016 | $398 | $4,023 | $308 | $3,715 |
| 2015 | $402 | $4,041 | $308 | $3,733 |
| 2014 | $416 | $4,261 | $308 | $3,953 |
Source: Public Records
Map
Nearby Homes