421 Spring St Southington, CT 06489
West Southington NeighborhoodEstimated Value: $487,532 - $564,000
3
Beds
3
Baths
2,166
Sq Ft
$244/Sq Ft
Est. Value
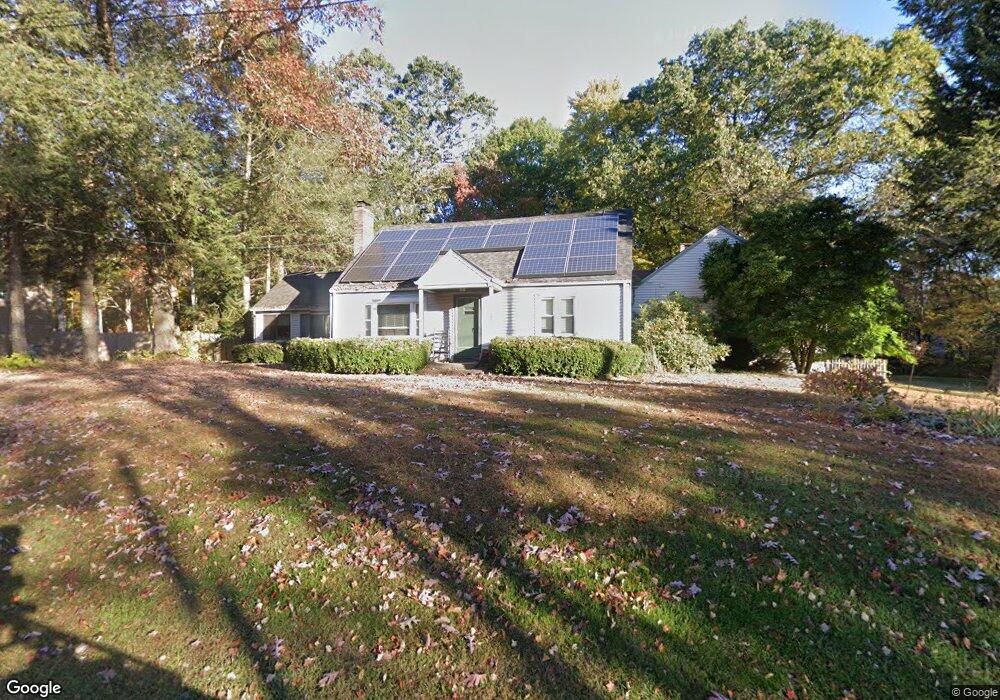
About This Home
This home is located at 421 Spring St, Southington, CT 06489 and is currently estimated at $529,133, approximately $244 per square foot. 421 Spring St is a home located in Hartford County with nearby schools including Reuben E. Thalberg Elementary School, Joseph A. Depaolo Middle School, and Southington High School.
Ownership History
Date
Name
Owned For
Owner Type
Purchase Details
Closed on
Jul 14, 2006
Sold by
Barker David L and Barker Carolyn L
Bought by
Noyes Matthew and Noyes Melissa
Current Estimated Value
Home Financials for this Owner
Home Financials are based on the most recent Mortgage that was taken out on this home.
Original Mortgage
$260,800
Interest Rate
6.71%
Purchase Details
Closed on
Sep 24, 2001
Sold by
Johnson Sonja E
Bought by
Barker David L and Barker Carolyn L
Create a Home Valuation Report for This Property
The Home Valuation Report is an in-depth analysis detailing your home's value as well as a comparison with similar homes in the area
Home Values in the Area
Average Home Value in this Area
Purchase History
| Date | Buyer | Sale Price | Title Company |
|---|---|---|---|
| Noyes Matthew | $326,000 | -- | |
| Barker David L | $217,000 | -- |
Source: Public Records
Mortgage History
| Date | Status | Borrower | Loan Amount |
|---|---|---|---|
| Open | Barker David L | $247,000 | |
| Closed | Barker David L | $247,331 | |
| Closed | Barker David L | $260,800 | |
| Closed | Barker David L | $48,900 |
Source: Public Records
Tax History
| Year | Tax Paid | Tax Assessment Tax Assessment Total Assessment is a certain percentage of the fair market value that is determined by local assessors to be the total taxable value of land and additions on the property. | Land | Improvement |
|---|---|---|---|---|
| 2025 | $7,232 | $217,760 | $64,070 | $153,690 |
| 2024 | $6,846 | $217,760 | $64,070 | $153,690 |
| 2023 | $6,611 | $217,760 | $64,070 | $153,690 |
| 2022 | $6,343 | $217,760 | $64,070 | $153,690 |
| 2021 | $6,322 | $217,760 | $64,070 | $153,690 |
| 2020 | $5,970 | $194,910 | $65,390 | $129,520 |
| 2019 | $5,972 | $194,910 | $65,390 | $129,520 |
| 2018 | $5,941 | $194,910 | $65,390 | $129,520 |
| 2017 | $5,941 | $194,910 | $65,390 | $129,520 |
| 2016 | $5,777 | $194,910 | $65,390 | $129,520 |
| 2015 | $5,562 | $190,880 | $62,270 | $128,610 |
| 2014 | $5,413 | $190,880 | $62,270 | $128,610 |
Source: Public Records
Map
Nearby Homes
- 554 Spring St
- 4 Maple Rd
- 2 Forest St
- 207 Lazy Ln Unit 11
- 1 Jensen Ct
- 81 Laning St
- 1384 West St
- 273 Queen St Unit 9C
- 309 Russet Ln
- 285 Queen St Unit 10I
- 285 Queen St
- 285 Queen St Unit 4F
- 1985 West St Unit 11
- 288 Laning St
- 0 Winchester Estates Lot 17
- 7 Eastview Rd
- 14 Redstone St
- 8 Redstone St
- 519 Village St
- 76 Kane St
Your Personal Tour Guide
Ask me questions while you tour the home.