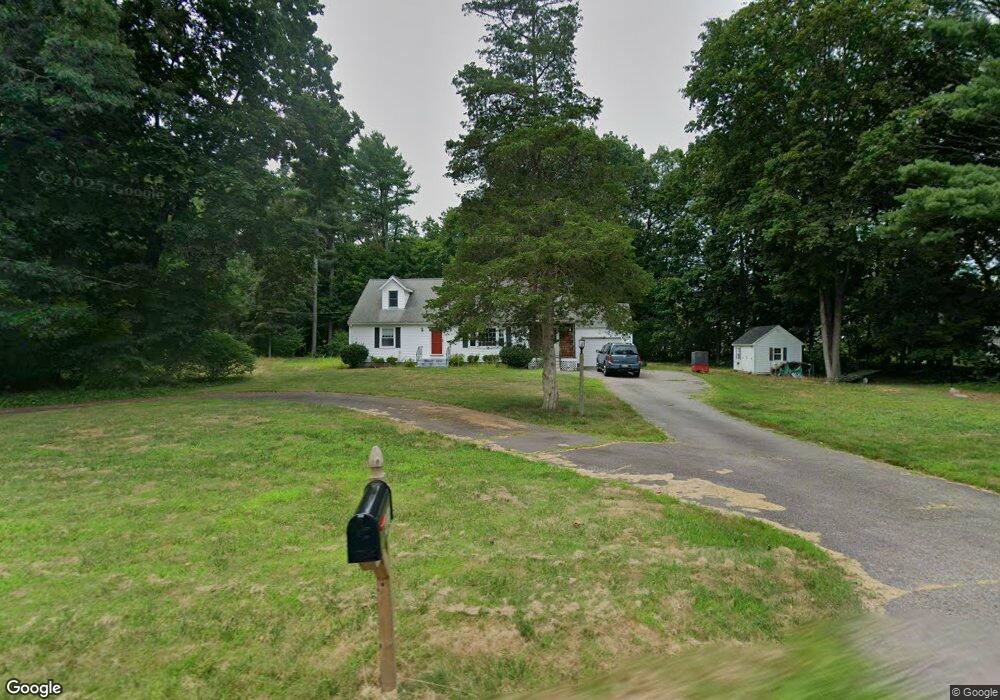
421 Williams St Mansfield, MA 02048
Estimated Value: $630,000 - $874,000
4
Beds
2
Baths
2,278
Sq Ft
$338/Sq Ft
Est. Value
About This Home
This home is located at 421 Williams St, Mansfield, MA 02048 and is currently estimated at $770,736, approximately $338 per square foot. 421 Williams St is a home located in Bristol County with nearby schools including Everett W. Robinson Elementary School, Jordan/Jackson Elementary School, and Harold L. Qualters Middle School.
Ownership History
Date
Name
Owned For
Owner Type
Purchase Details
Closed on
Jun 24, 2022
Sold by
Elliott John W and Elliott Laura A
Bought by
Elliott John W
Current Estimated Value
Home Financials for this Owner
Home Financials are based on the most recent Mortgage that was taken out on this home.
Original Mortgage
$100,000
Outstanding Balance
$83,181
Interest Rate
4.48%
Mortgage Type
New Conventional
Estimated Equity
$687,555
Purchase Details
Closed on
Dec 21, 2000
Sold by
Brown Jane L and Folcik Wanda E
Bought by
Elliott John W and Elliott Laura A
Home Financials for this Owner
Home Financials are based on the most recent Mortgage that was taken out on this home.
Original Mortgage
$160,000
Interest Rate
7.71%
Mortgage Type
Purchase Money Mortgage
Create a Home Valuation Report for This Property
The Home Valuation Report is an in-depth analysis detailing your home's value as well as a comparison with similar homes in the area
Home Values in the Area
Average Home Value in this Area
Purchase History
| Date | Buyer | Sale Price | Title Company |
|---|---|---|---|
| Elliott John W | -- | None Available | |
| Elliott John W | -- | None Available | |
| Elliott John W | $200,000 | -- | |
| Elliott John W | $200,000 | -- |
Source: Public Records
Mortgage History
| Date | Status | Borrower | Loan Amount |
|---|---|---|---|
| Open | Elliott John W | $100,000 | |
| Closed | Elliott John W | $100,000 | |
| Previous Owner | Elliott John W | $136,000 | |
| Previous Owner | Elliott John W | $147,000 | |
| Previous Owner | Elliott John W | $160,000 |
Source: Public Records
Tax History
| Year | Tax Paid | Tax Assessment Tax Assessment Total Assessment is a certain percentage of the fair market value that is determined by local assessors to be the total taxable value of land and additions on the property. | Land | Improvement |
|---|---|---|---|---|
| 2025 | $8,089 | $614,200 | $254,600 | $359,600 |
| 2024 | $8,344 | $618,100 | $254,600 | $363,500 |
| 2023 | $8,110 | $575,600 | $254,600 | $321,000 |
| 2022 | $7,806 | $514,600 | $235,900 | $278,700 |
| 2021 | $7,298 | $475,100 | $206,300 | $268,800 |
| 2020 | $6,835 | $445,000 | $196,500 | $248,500 |
| 2019 | $6,310 | $414,600 | $163,800 | $250,800 |
| 2018 | $1,653 | $400,400 | $156,400 | $244,000 |
| 2017 | $5,610 | $373,500 | $152,100 | $221,400 |
| 2016 | $5,401 | $350,500 | $144,600 | $205,900 |
| 2015 | $5,361 | $345,900 | $144,600 | $201,300 |
Source: Public Records
Map
Nearby Homes
- 24 Maverick Dr
- 128 Tremont St
- 25 Shepherd St
- 17 Childs Ln
- 150 Gilbert St
- 14 Claire Ave
- 1769 West St
- 9 Coach Rd
- 84 Messenger St
- 40 Treasure Island Rd
- 401 South St
- 25 Munroe Dr
- 33 Colonial Way
- 16 Treasure Island Rd
- 346 South St
- 46 Mirimichi St
- 38 Mirimichi St
- 115 Westfield Dr
- 57 Vine St
- 28 Messenger St
Your Personal Tour Guide
Ask me questions while you tour the home.