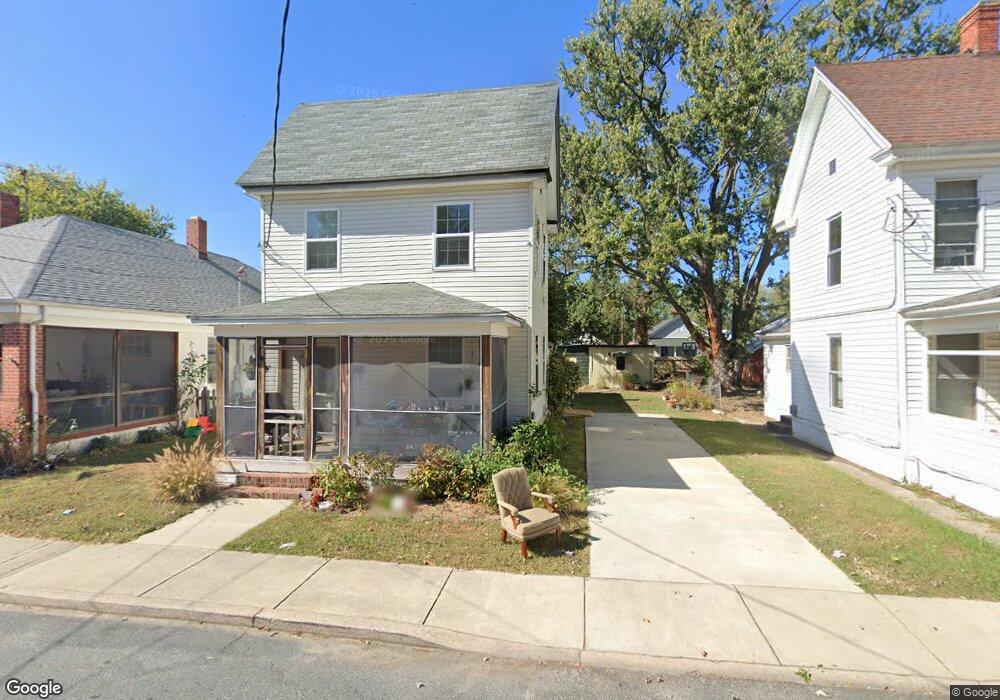
421 Willis St Cambridge, MD 21613
Estimated Value: $136,000 - $158,000
Studio
1
Bath
1,294
Sq Ft
$112/Sq Ft
Est. Value
About This Home
This home is located at 421 Willis St, Cambridge, MD 21613 and is currently estimated at $144,728, approximately $111 per square foot. 421 Willis St is a home located in Dorchester County with nearby schools including Sandy Hill Elementary School, Mace's Lane Middle School, and Cambridge-South Dorchester High School.
Ownership History
Date
Name
Owned For
Owner Type
Purchase Details
Closed on
Dec 18, 2003
Sold by
Burgwin Kenneth F Joanna Mccoy
Bought by
Hall Florence D
Current Estimated Value
Purchase Details
Closed on
Jun 10, 2002
Sold by
Burgwin Kenneth F
Bought by
Burgwin Kenneth F and Mccoy Joanna
Purchase Details
Closed on
Dec 12, 1988
Sold by
Hughes Carl David and Hughes Terri E
Bought by
Burgwin Kenneth F And
Home Financials for this Owner
Home Financials are based on the most recent Mortgage that was taken out on this home.
Original Mortgage
$27,500
Interest Rate
10.46%
Create a Home Valuation Report for This Property
The Home Valuation Report is an in-depth analysis detailing your home's value as well as a comparison with similar homes in the area
Home Values in the Area
Average Home Value in this Area
Purchase History
| Date | Buyer | Sale Price | Title Company |
|---|---|---|---|
| Hall Florence D | -- | -- | |
| Burgwin Kenneth F | -- | -- | |
| Burgwin Kenneth F And | $27,500 | -- |
Source: Public Records
Mortgage History
| Date | Status | Borrower | Loan Amount |
|---|---|---|---|
| Previous Owner | Burgwin Kenneth F And | $27,500 |
Source: Public Records
Tax History
| Year | Tax Paid | Tax Assessment Tax Assessment Total Assessment is a certain percentage of the fair market value that is determined by local assessors to be the total taxable value of land and additions on the property. | Land | Improvement |
|---|---|---|---|---|
| 2025 | $1,609 | $85,900 | $30,100 | $55,800 |
| 2024 | $1,436 | $82,167 | $0 | $0 |
| 2023 | $1,436 | $78,433 | $0 | $0 |
| 2022 | $2,736 | $74,700 | $30,100 | $44,600 |
| 2021 | $1,266 | $71,100 | $0 | $0 |
| 2020 | $1,266 | $67,500 | $0 | $0 |
| 2019 | $897 | $63,900 | $21,000 | $42,900 |
| 2018 | $1,186 | $63,900 | $21,000 | $42,900 |
| 2017 | $1,186 | $63,900 | $0 | $0 |
| 2016 | -- | $76,900 | $0 | $0 |
| 2015 | -- | $76,900 | $0 | $0 |
| 2014 | -- | $76,900 | $0 | $0 |
Source: Public Records
Map
Nearby Homes
- 0 Edgewood Ave Unit MDDO2010918
- 0 Edgewood Ave Unit MDDO2010930
- 0 Edgewood Ave Unit MDDO2010928
- 0 Edgewood Ave Unit MDDO2010924
- 0 Edgewood Ave Unit MDDO2010926
- 0 Edgewood Ave Unit MDDO2010932
- 409 Oakley St
- 402 Oakley St
- 430 Leonards Ln
- 810 Locust St
- 0 Park Ln
- 817 Locust St
- 1105 Holland Ave
- 521 Edgewood Ave
- 607 Edgewood Ave
- 321 Choptank Ave
- 606 Edgewood Ave
- 314 Belvedere Ave
- 832 Park Ln
- 709 Church St
Your Personal Tour Guide
Ask me questions while you tour the home.