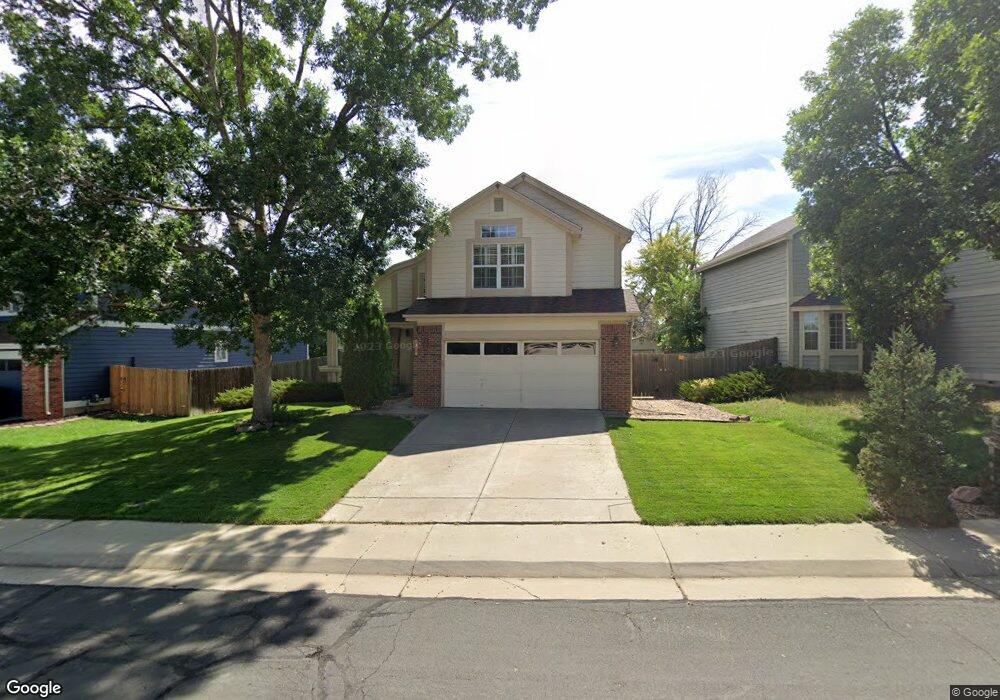
4210 E 106th Place Thornton, CO 80233
Wyndemere NeighborhoodEstimated Value: $502,248 - $536,000
3
Beds
3
Baths
1,823
Sq Ft
$284/Sq Ft
Est. Value
About This Home
This home is located at 4210 E 106th Place, Thornton, CO 80233 and is currently estimated at $517,562, approximately $283 per square foot. 4210 E 106th Place is a home located in Adams County with nearby schools including Riverdale Elementary School, Shadow Ridge Middle School, and Thornton High School.
Ownership History
Date
Name
Owned For
Owner Type
Purchase Details
Closed on
Jan 3, 2003
Sold by
Belle Creek Llc
Bought by
Kupfner Johnathon and Kupfner Lauren
Current Estimated Value
Home Financials for this Owner
Home Financials are based on the most recent Mortgage that was taken out on this home.
Original Mortgage
$171,687
Outstanding Balance
$70,777
Interest Rate
6.06%
Mortgage Type
FHA
Estimated Equity
$446,785
Purchase Details
Closed on
Dec 30, 1997
Sold by
Hausler Charles R and Hausler Natalie D
Bought by
Cornell Cindy L
Home Financials for this Owner
Home Financials are based on the most recent Mortgage that was taken out on this home.
Original Mortgage
$108,450
Interest Rate
7.15%
Purchase Details
Closed on
Apr 21, 1995
Sold by
U S Home Corp
Bought by
Hausler Charles R and Hausler Natalie D
Home Financials for this Owner
Home Financials are based on the most recent Mortgage that was taken out on this home.
Original Mortgage
$120,000
Interest Rate
6.5%
Create a Home Valuation Report for This Property
The Home Valuation Report is an in-depth analysis detailing your home's value as well as a comparison with similar homes in the area
Home Values in the Area
Average Home Value in this Area
Purchase History
| Date | Buyer | Sale Price | Title Company |
|---|---|---|---|
| Kupfner Johnathon | $174,382 | Land Title Guarantee Company | |
| Cornell Cindy L | $159,950 | Empire Title & Escrow | |
| Hausler Charles R | $130,000 | Stewart Title |
Source: Public Records
Mortgage History
| Date | Status | Borrower | Loan Amount |
|---|---|---|---|
| Open | Kupfner Johnathon | $171,687 | |
| Previous Owner | Cornell Cindy L | $108,450 | |
| Previous Owner | Hausler Charles R | $120,000 |
Source: Public Records
Tax History
| Year | Tax Paid | Tax Assessment Tax Assessment Total Assessment is a certain percentage of the fair market value that is determined by local assessors to be the total taxable value of land and additions on the property. | Land | Improvement |
|---|---|---|---|---|
| 2025 | $2,738 | $34,610 | $7,820 | $26,790 |
| 2024 | $2,738 | $31,820 | $7,190 | $24,630 |
| 2023 | $2,711 | $36,940 | $7,040 | $29,900 |
| 2022 | $2,040 | $25,470 | $7,230 | $18,240 |
| 2021 | $2,108 | $25,470 | $7,230 | $18,240 |
| 2020 | $2,207 | $26,930 | $7,440 | $19,490 |
| 2019 | $3,010 | $26,930 | $7,440 | $19,490 |
| 2018 | $2,792 | $24,260 | $5,760 | $18,500 |
| 2017 | $2,538 | $24,260 | $5,760 | $18,500 |
| 2016 | $2,083 | $19,380 | $3,980 | $15,400 |
| 2015 | $2,080 | $19,380 | $3,980 | $15,400 |
| 2014 | $1,835 | $16,620 | $3,340 | $13,280 |
Source: Public Records
Map
Nearby Homes
- 3620 E 106th Ave
- 3583 E 106th Ave
- 10513 Madison St
- 11030 Dahlia Dr
- 3291 E 103rd Place Unit 1507
- 10761 Cook Ct
- 4211 E 100th Ave Unit 452
- 10201 Riverdale Rd Unit 63
- 4211 E 100th Ave Unit 465
- 10201 Riverdale Rd Unit 90
- 10201 Riverdale Rd Unit 61
- 10201 Riverdale Rd Unit 187
- 10201 Riverdale Rd Unit 150
- 10201 Riverdale Rd Unit 32
- 4211 E 100th Ave Unit 323
- 11135 Clermont Dr
- 11170 Cherry Cir
- 3260 E 103rd Place Unit 908
- 11117 Eudora Cir
- 3262 E 103rd Dr Unit 1806
- 4214 E 106th Place
- 4206 E 106th Place
- 4215 E 106th Ct
- 4218 E 106th Place
- 4211 E 106th Ct
- 10518 Bellaire St
- 10514 Bellaire St
- 4213 E 106th Place
- 4209 E 106th Place
- 4219 E 106th Ct
- 10510 Bellaire St
- 4222 E 106th Place
- 4217 E 106th Place
- 4205 E 106th Place
- 10602 Bellaire St
- 4212 E 106th Ct
- 10506 Bellaire St
- 4221 E 106th Place
- 10607 Birch St
- 4223 E 106th Ct
Your Personal Tour Guide
Ask me questions while you tour the home.