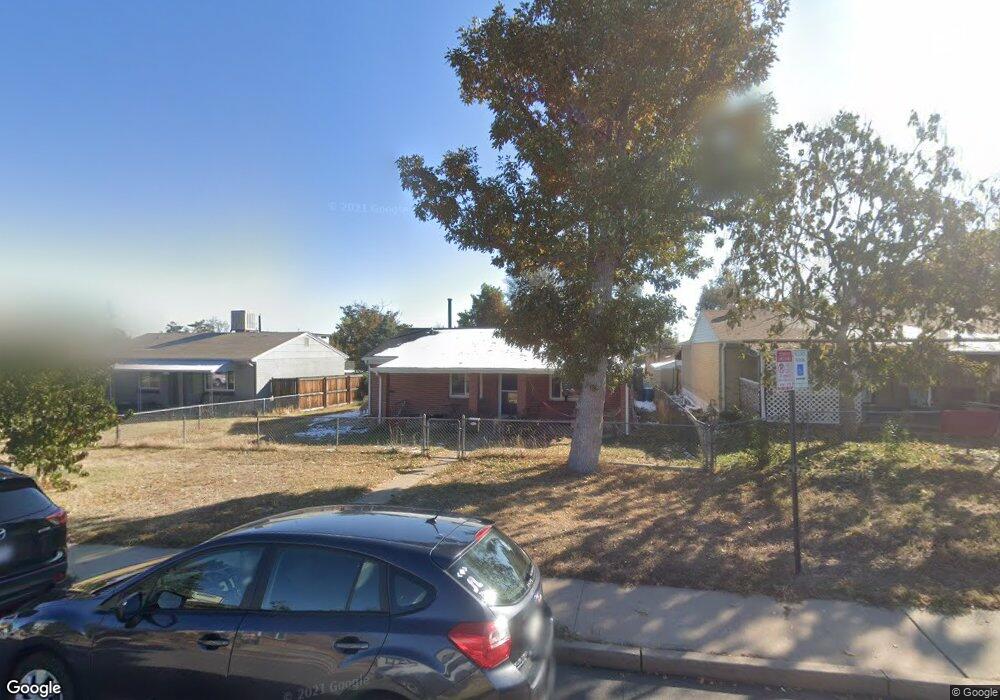
4210 Osage St Denver, CO 80211
Sunnyside NeighborhoodEstimated Value: $568,000 - $686,000
5
Beds
2
Baths
1,714
Sq Ft
$367/Sq Ft
Est. Value
About This Home
This home is located at 4210 Osage St, Denver, CO 80211 and is currently estimated at $628,948, approximately $366 per square foot. 4210 Osage St is a home located in Denver County with nearby schools including Bryant Webster Dual Language School, Denver Montessori Junior/Senior High School, and Skinner Middle School.
Ownership History
Date
Name
Owned For
Owner Type
Purchase Details
Closed on
Mar 30, 2011
Sold by
Dp Assets Llc
Bought by
Grisanti David
Current Estimated Value
Home Financials for this Owner
Home Financials are based on the most recent Mortgage that was taken out on this home.
Original Mortgage
$161,600
Outstanding Balance
$112,732
Interest Rate
5.04%
Mortgage Type
New Conventional
Estimated Equity
$516,216
Purchase Details
Closed on
Sep 20, 2010
Sold by
Balderrama Elvira V
Bought by
Dp Assets Llc
Purchase Details
Closed on
Sep 1, 2005
Sold by
Balderrama Elvira V
Bought by
Balderrama Elvira and Balderrama Louis
Create a Home Valuation Report for This Property
The Home Valuation Report is an in-depth analysis detailing your home's value as well as a comparison with similar homes in the area
Home Values in the Area
Average Home Value in this Area
Purchase History
| Date | Buyer | Sale Price | Title Company |
|---|---|---|---|
| Grisanti David | $202,000 | Assured Title | |
| Dp Assets Llc | -- | None Available | |
| Balderrama Elvira | -- | -- |
Source: Public Records
Mortgage History
| Date | Status | Borrower | Loan Amount |
|---|---|---|---|
| Open | Grisanti David | $161,600 |
Source: Public Records
Tax History Compared to Growth
Tax History
| Year | Tax Paid | Tax Assessment Tax Assessment Total Assessment is a certain percentage of the fair market value that is determined by local assessors to be the total taxable value of land and additions on the property. | Land | Improvement |
|---|---|---|---|---|
| 2024 | $3,604 | $45,510 | $41,390 | $4,120 |
| 2023 | $3,526 | $45,510 | $41,390 | $4,120 |
| 2022 | $3,166 | $39,810 | $39,740 | $70 |
| 2021 | $3,056 | $40,950 | $40,880 | $70 |
| 2020 | $2,557 | $34,460 | $33,670 | $790 |
| 2019 | $2,485 | $34,460 | $33,670 | $790 |
| 2018 | $2,029 | $26,230 | $24,990 | $1,240 |
| 2017 | $2,023 | $26,230 | $24,990 | $1,240 |
| 2016 | $1,925 | $23,600 | $18,021 | $5,579 |
| 2015 | $1,844 | $23,600 | $18,021 | $5,579 |
| 2014 | $1,345 | $16,190 | $5,532 | $10,658 |
Source: Public Records
Map
Nearby Homes