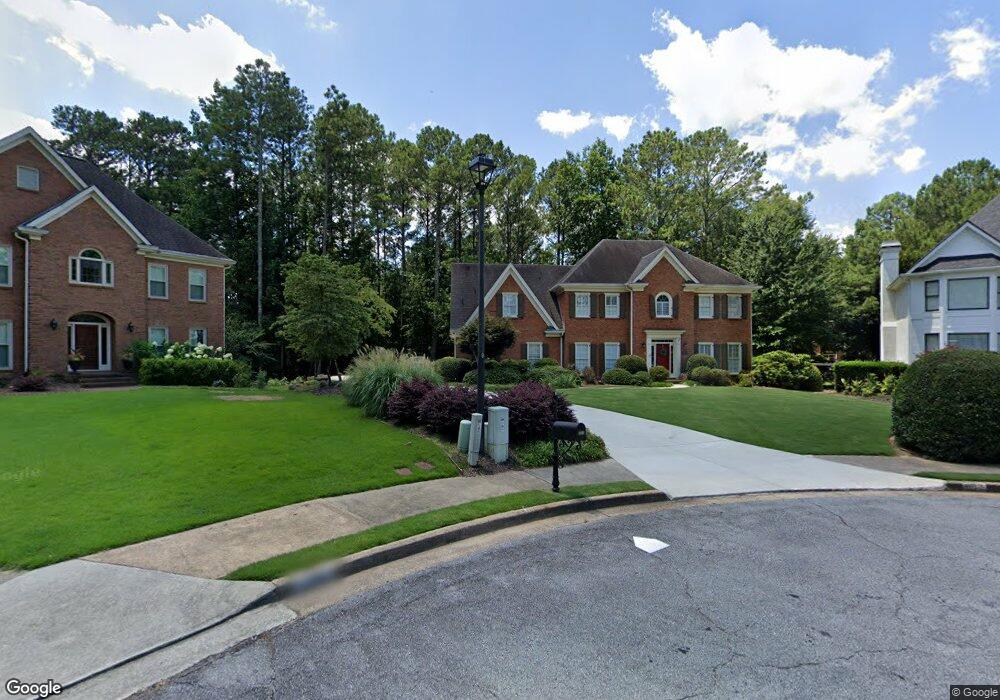
4210 Quail Ridge Way Unit 2 Norcross, GA 30092
Estimated Value: $969,000 - $1,200,000
6
Beds
5
Baths
3,290
Sq Ft
$319/Sq Ft
Est. Value
About This Home
This home is located at 4210 Quail Ridge Way Unit 2, Norcross, GA 30092 and is currently estimated at $1,048,884, approximately $318 per square foot. 4210 Quail Ridge Way Unit 2 is a home located in Gwinnett County with nearby schools including Simpson Elementary School, Pinckneyville Middle School, and Norcross High School.
Ownership History
Date
Name
Owned For
Owner Type
Purchase Details
Closed on
Jul 31, 2003
Sold by
Banks Lynn S
Bought by
Shin Kiho
Current Estimated Value
Home Financials for this Owner
Home Financials are based on the most recent Mortgage that was taken out on this home.
Original Mortgage
$416,000
Outstanding Balance
$181,434
Interest Rate
5.72%
Mortgage Type
New Conventional
Estimated Equity
$867,450
Purchase Details
Closed on
Oct 1, 2001
Sold by
Banks Peter L
Bought by
Banks Lynn S
Home Financials for this Owner
Home Financials are based on the most recent Mortgage that was taken out on this home.
Original Mortgage
$247,500
Interest Rate
6.85%
Mortgage Type
New Conventional
Purchase Details
Closed on
May 28, 1998
Sold by
Andrews John S and Andrews Linda L
Bought by
Banks Peter L and Banks Lynn S
Home Financials for this Owner
Home Financials are based on the most recent Mortgage that was taken out on this home.
Original Mortgage
$280,000
Interest Rate
7.15%
Mortgage Type
New Conventional
Create a Home Valuation Report for This Property
The Home Valuation Report is an in-depth analysis detailing your home's value as well as a comparison with similar homes in the area
Home Values in the Area
Average Home Value in this Area
Purchase History
| Date | Buyer | Sale Price | Title Company |
|---|---|---|---|
| Shin Kiho | $520,000 | -- | |
| Banks Lynn S | -- | -- | |
| Banks Peter L | -- | -- | |
| Banks Peter L | $387,000 | -- |
Source: Public Records
Mortgage History
| Date | Status | Borrower | Loan Amount |
|---|---|---|---|
| Open | Shin Kiho | $416,000 | |
| Previous Owner | Banks Peter L | $247,500 | |
| Previous Owner | Banks Peter L | $280,000 |
Source: Public Records
Tax History Compared to Growth
Tax History
| Year | Tax Paid | Tax Assessment Tax Assessment Total Assessment is a certain percentage of the fair market value that is determined by local assessors to be the total taxable value of land and additions on the property. | Land | Improvement |
|---|---|---|---|---|
| 2025 | $10,554 | $389,120 | $61,960 | $327,160 |
| 2024 | $10,439 | $373,080 | $71,200 | $301,880 |
| 2023 | $10,439 | $309,960 | $64,000 | $245,960 |
| 2022 | $8,368 | $271,600 | $52,000 | $219,600 |
| 2021 | $8,129 | $251,880 | $49,840 | $202,040 |
| 2020 | $8,187 | $251,880 | $49,840 | $202,040 |
| 2019 | $7,527 | $232,840 | $44,000 | $188,840 |
| 2018 | $7,015 | $207,920 | $36,000 | $171,920 |
| 2016 | $6,734 | $197,000 | $36,000 | $161,000 |
| 2015 | $6,814 | $197,000 | $36,000 | $161,000 |
| 2014 | $5,747 | $164,720 | $36,000 | $128,720 |
Source: Public Records
Map
Nearby Homes
- 5970 Rachel Ridge Unit 2
- 6169 Poplar Bluff Cir
- 5961 Ranger Ct
- 6040 Neely Farm Dr Unit 3
- 5885 Match Point
- 4053 Spalding Hollow NW
- 3922 Glen Meadow Dr
- 4405 River Trail Dr
- 4410 River Trail Dr Unit 383
- 0 Hawk Run Unit 7571401
- 0 Hawk Run
- 4291 River Bottom Dr
- 3962 Gunnin Rd
- 3910 Spalding Bluff Dr
- 4575 Dairy Way
- 3710 Wedgewood Chase Unit 22
- 5786 Broxton Cir
- 5863 Revington Dr
- 4200 Quail Ridge Way
- 5990 Rachel Ridge
- 5980 Rachel Ridge
- 4220 Quail Ridge Way
- 6224 Poplar Bluff Cir
- 6214 Poplar Bluff Cir
- 6234 Poplar Bluff Cir
- 4201 Quail Ridge Way
- 6000 Rachel Ridge
- 4230 Quail Ridge Way
- 6204 Poplar Bluff Cir
- 4211 Quail Ridge Way
- 5960 Rachel Ridge
- 6194 Poplar Bluff Cir
- 5991 Rachel Ridge Unit 2
- 5991 Rachel Ridge
- 6244 Poplar Bluff Cir Unit 34
- 6244 Poplar Bluff Cir
- 6010 Rachel Ridge
- 4221 Quail Ridge Way