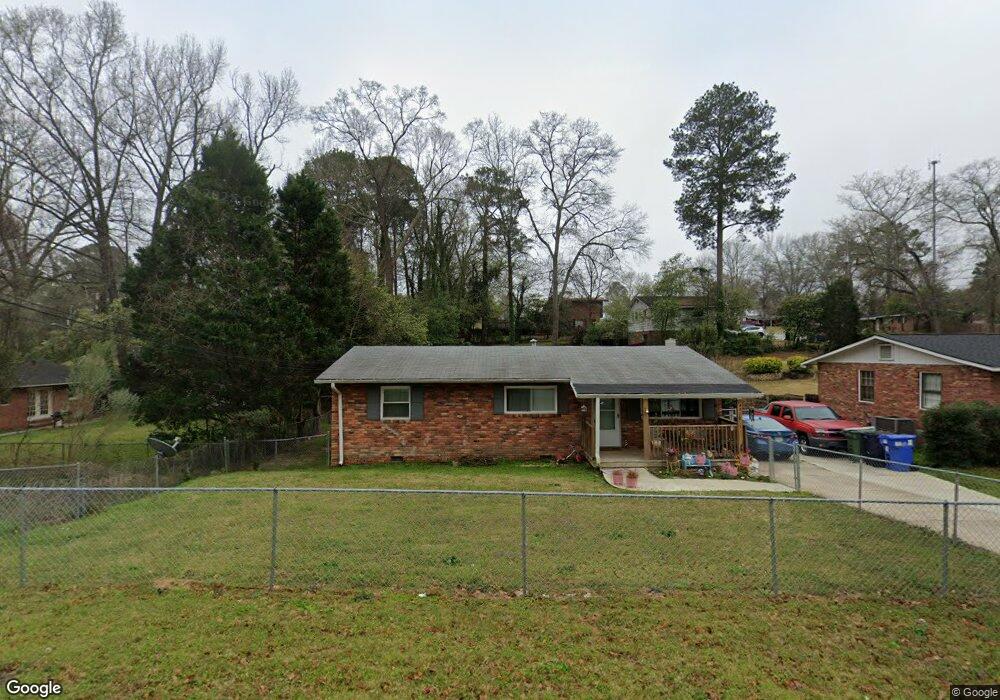
4210 Wilbur Dr Columbus, GA 31909
Northern Columbus NeighborhoodEstimated Value: $132,729 - $140,000
3
Beds
2
Baths
1,075
Sq Ft
$126/Sq Ft
Est. Value
About This Home
This home is located at 4210 Wilbur Dr, Columbus, GA 31909 and is currently estimated at $135,910, approximately $126 per square foot. 4210 Wilbur Dr is a home located in Muscogee County with nearby schools including Gentian Elementary School, Midland Middle School, and Hardaway High School.
Ownership History
Date
Name
Owned For
Owner Type
Purchase Details
Closed on
Apr 20, 2015
Sold by
Sec Of Housing & U
Bought by
Brewer David Edward and Marinaro Kalee Lynn
Current Estimated Value
Purchase Details
Closed on
Nov 6, 2014
Sold by
Nationstar Mtg Llc
Bought by
Sec Of Housing & Urban
Purchase Details
Closed on
Nov 4, 2014
Sold by
Macon Dustin
Bought by
Nationstar Mtg Llc
Purchase Details
Closed on
May 26, 2009
Sold by
Macon Anne M
Bought by
Macon Dustin
Home Financials for this Owner
Home Financials are based on the most recent Mortgage that was taken out on this home.
Original Mortgage
$102,738
Interest Rate
4.81%
Mortgage Type
FHA
Purchase Details
Closed on
Mar 5, 2008
Sold by
Gunn Melody H
Bought by
Macon Dustin and Macon Anne M
Home Financials for this Owner
Home Financials are based on the most recent Mortgage that was taken out on this home.
Original Mortgage
$98,208
Interest Rate
5.46%
Mortgage Type
FHA
Create a Home Valuation Report for This Property
The Home Valuation Report is an in-depth analysis detailing your home's value as well as a comparison with similar homes in the area
Home Values in the Area
Average Home Value in this Area
Purchase History
| Date | Buyer | Sale Price | Title Company |
|---|---|---|---|
| Brewer David Edward | -- | -- | |
| Sec Of Housing & Urban | -- | -- | |
| Nationstar Mtg Llc | $37,440 | -- | |
| Macon Dustin | -- | None Available | |
| Macon Dustin | $99,000 | None Available |
Source: Public Records
Mortgage History
| Date | Status | Borrower | Loan Amount |
|---|---|---|---|
| Previous Owner | Macon Dustin | $102,738 | |
| Previous Owner | Macon Dustin | $98,208 |
Source: Public Records
Tax History Compared to Growth
Tax History
| Year | Tax Paid | Tax Assessment Tax Assessment Total Assessment is a certain percentage of the fair market value that is determined by local assessors to be the total taxable value of land and additions on the property. | Land | Improvement |
|---|---|---|---|---|
| 2025 | $112 | $25,496 | $7,844 | $17,652 |
| 2024 | $111 | $25,496 | $7,844 | $17,652 |
| 2023 | $13 | $25,496 | $7,844 | $17,652 |
| 2022 | $115 | $34,004 | $7,844 | $26,160 |
| 2021 | $108 | $27,168 | $7,844 | $19,324 |
| 2020 | $108 | $27,168 | $7,844 | $19,324 |
| 2019 | $110 | $27,168 | $7,844 | $19,324 |
| 2018 | $110 | $27,168 | $7,844 | $19,324 |
| 2017 | $113 | $27,168 | $7,844 | $19,324 |
| 2016 | $114 | $16,041 | $3,274 | $12,767 |
| 2015 | $552 | $25,801 | $3,274 | $22,527 |
| 2014 | $1,079 | $39,341 | $3,274 | $36,067 |
| 2013 | -- | $39,341 | $3,274 | $36,067 |
Source: Public Records
Map
Nearby Homes
- 4320 Canady St
- 4036 Wilbur Dr
- 5921 Lawson St
- 5829 Moon Rd
- 5915 Frazier Dr
- 6104 Candlestick Loop
- 6158 Arrington Dr
- 5926 Frazier Dr
- 5224 Miller Rd
- 5636 Webb Ave
- 5866 Morningside Dr
- 6136 Morningside Dr
- 4847 Warm Springs Rd
- 6200 Karen Ct
- 3710 Winkfield Place
- 5540 Rodgers Dr
- 4245 N Oaks Dr
- 5517 Rodgers Dr
- 5623 Hodges Dr
- 3732 Arrel Dr