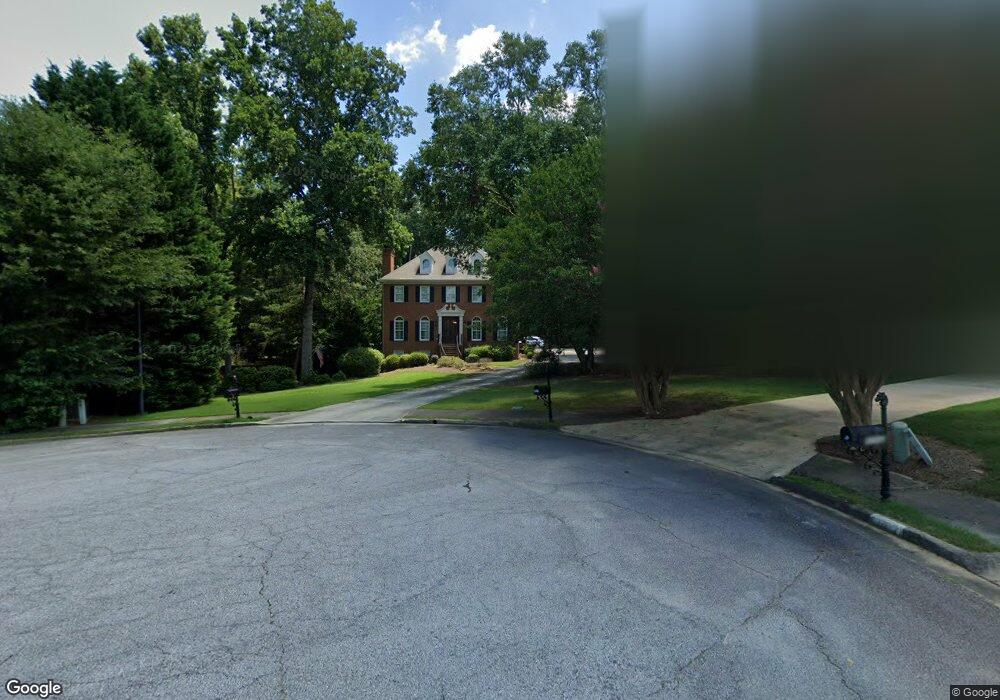
4211 Mayapple Ct Unit Two Norcross, GA 30092
Estimated Value: $1,017,000 - $1,138,000
4
Beds
5
Baths
3,456
Sq Ft
$311/Sq Ft
Est. Value
About This Home
This home is located at 4211 Mayapple Ct Unit Two, Norcross, GA 30092 and is currently estimated at $1,075,541, approximately $311 per square foot. 4211 Mayapple Ct Unit Two is a home located in Gwinnett County with nearby schools including Simpson Elementary School, Pinckneyville Middle School, and Norcross High School.
Ownership History
Date
Name
Owned For
Owner Type
Purchase Details
Closed on
Nov 3, 2017
Sold by
Floyd Ryan
Bought by
Deyton Joshua T and Deyton Sarah Ott
Current Estimated Value
Home Financials for this Owner
Home Financials are based on the most recent Mortgage that was taken out on this home.
Original Mortgage
$401,250
Outstanding Balance
$334,621
Interest Rate
3.85%
Mortgage Type
New Conventional
Estimated Equity
$740,920
Purchase Details
Closed on
Jan 5, 2016
Sold by
Sommers John
Bought by
Floyd Ryan
Purchase Details
Closed on
May 9, 2002
Sold by
Jarvis Jefferson J and Jarvis Donna D
Bought by
Sommers John and Sommers Tanya
Create a Home Valuation Report for This Property
The Home Valuation Report is an in-depth analysis detailing your home's value as well as a comparison with similar homes in the area
Home Values in the Area
Average Home Value in this Area
Purchase History
| Date | Buyer | Sale Price | Title Company |
|---|---|---|---|
| Deyton Joshua T | $535,000 | -- | |
| Deyton Joshua T | $535,000 | -- | |
| Floyd Ryan | $495,000 | -- | |
| Floyd Ryan | $495,000 | -- | |
| Sommers John | $449,900 | -- | |
| Sommers John | $449,900 | -- |
Source: Public Records
Mortgage History
| Date | Status | Borrower | Loan Amount |
|---|---|---|---|
| Open | Deyton Joshua T | $401,250 | |
| Closed | Deyton Joshua T | $80,250 |
Source: Public Records
Tax History Compared to Growth
Tax History
| Year | Tax Paid | Tax Assessment Tax Assessment Total Assessment is a certain percentage of the fair market value that is determined by local assessors to be the total taxable value of land and additions on the property. | Land | Improvement |
|---|---|---|---|---|
| 2025 | -- | $390,000 | $61,960 | $328,040 |
| 2024 | $10,711 | $374,120 | $71,200 | $302,920 |
| 2023 | $10,711 | $310,840 | $64,000 | $246,840 |
| 2022 | $8,635 | $272,400 | $52,000 | $220,400 |
| 2021 | $8,395 | $252,600 | $49,840 | $202,760 |
| 2020 | $8,452 | $252,600 | $49,840 | $202,760 |
| 2019 | $7,774 | $233,560 | $44,000 | $189,560 |
| 2018 | $7,268 | $208,960 | $36,000 | $172,960 |
| 2016 | $5,745 | $168,000 | $36,000 | $132,000 |
| 2015 | $5,810 | $168,000 | $36,000 | $132,000 |
| 2014 | -- | $155,120 | $34,240 | $120,880 |
Source: Public Records
Map
Nearby Homes
- 6169 Poplar Bluff Cir
- 5970 Rachel Ridge Unit 2
- 6040 Neely Farm Dr Unit 3
- 5961 Ranger Ct
- 4053 Spalding Hollow NW
- 4291 River Bottom Dr
- 4405 River Trail Dr
- 5885 Match Point
- 4410 River Trail Dr Unit 383
- 3922 Glen Meadow Dr
- 0 Hawk Run Unit 7571401
- 0 Hawk Run
- 3910 Spalding Bluff Dr
- 3962 Gunnin Rd
- 4575 Dairy Way
- 3710 Wedgewood Chase Unit 22
- 6425 Deerings Ln Unit 6425
- 6433 Deerings Ln
- 4211 Mayapple Ct Unit 2
- 4211 Mayapple Ct
- 4201 Mayapple Ct Unit 2
- 6030 Rachel Ridge
- 6040 Rachel Ridge
- 6040 Rachel Ridge Unit 2
- 6154 Poplar Bluff Cir
- 6050 Rachel Ridge
- 6164 Poplar Bluff Cir
- 6020 Rachel Ridge
- 6144 Poplar Bluff Cir
- 0 Mayapple Ct Unit 3199397
- 0 Mayapple Ct Unit 7462251
- 0 Mayapple Ct
- 4230 4230 Mayapple Ct
- 6174 Poplar Bluff Cir Unit 2
- 4165 Poplar Spring Ct Unit 1
- 4200 Mayapple Ct
- 6031 Rachel Ridge
- 6010 Rachel Ridge