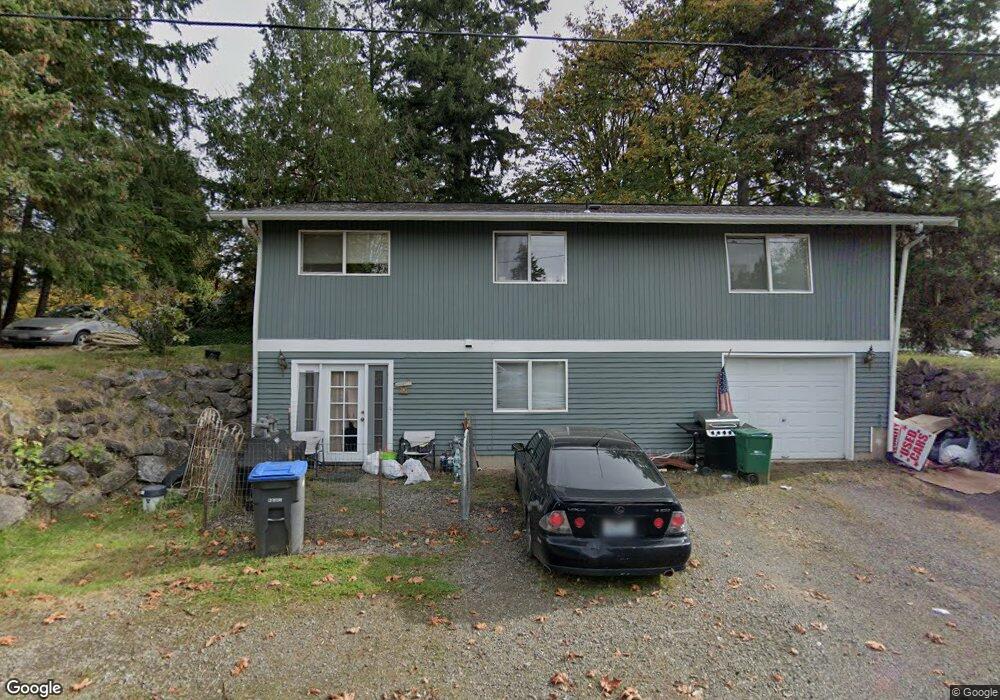
4211 Ridgeway Place Bremerton, WA 98312
Kitsap Lake NeighborhoodEstimated Value: $473,000 - $536,000
3
Beds
2
Baths
1,846
Sq Ft
$270/Sq Ft
Est. Value
About This Home
This home is located at 4211 Ridgeway Place, Bremerton, WA 98312 and is currently estimated at $498,590, approximately $270 per square foot. 4211 Ridgeway Place is a home located in Kitsap County with nearby schools including Kitsap Lake Elementary School, Mountain View Middle School, and Bremerton High School.
Ownership History
Date
Name
Owned For
Owner Type
Purchase Details
Closed on
Mar 13, 2019
Sold by
Kienzle Ivy G
Bought by
Kienzle Dwight D
Current Estimated Value
Purchase Details
Closed on
Dec 29, 2006
Sold by
Robinson Dale H and Turk Robinson Helen
Bought by
Kienzle Dwight and Kienzle Ivy
Home Financials for this Owner
Home Financials are based on the most recent Mortgage that was taken out on this home.
Original Mortgage
$217,550
Outstanding Balance
$129,645
Interest Rate
6.16%
Mortgage Type
Purchase Money Mortgage
Estimated Equity
$368,945
Purchase Details
Closed on
Sep 23, 2002
Sold by
Truemper Daniel W and Truemper Candee K
Bought by
Robinson Dale H and Turk Helen A
Home Financials for this Owner
Home Financials are based on the most recent Mortgage that was taken out on this home.
Original Mortgage
$106,000
Interest Rate
6.16%
Mortgage Type
Purchase Money Mortgage
Create a Home Valuation Report for This Property
The Home Valuation Report is an in-depth analysis detailing your home's value as well as a comparison with similar homes in the area
Home Values in the Area
Average Home Value in this Area
Purchase History
| Date | Buyer | Sale Price | Title Company |
|---|---|---|---|
| Kienzle Dwight D | -- | None Available | |
| Kienzle Dwight | $229,280 | Transnation Title | |
| Robinson Dale H | $117,810 | Land Title Company |
Source: Public Records
Mortgage History
| Date | Status | Borrower | Loan Amount |
|---|---|---|---|
| Open | Kienzle Dwight | $217,550 | |
| Previous Owner | Robinson Dale H | $106,000 |
Source: Public Records
Tax History Compared to Growth
Tax History
| Year | Tax Paid | Tax Assessment Tax Assessment Total Assessment is a certain percentage of the fair market value that is determined by local assessors to be the total taxable value of land and additions on the property. | Land | Improvement |
|---|---|---|---|---|
| 2026 | $4,432 | $444,320 | $115,680 | $328,640 |
| 2025 | $4,432 | $444,320 | $115,680 | $328,640 |
| 2024 | $4,282 | $444,320 | $115,680 | $328,640 |
| 2023 | $3,677 | $378,220 | $104,720 | $273,500 |
| 2022 | $3,654 | $332,890 | $92,010 | $240,880 |
| 2021 | $3,368 | $287,550 | $79,290 | $208,260 |
| 2020 | $2,974 | $261,480 | $72,030 | $189,450 |
| 2019 | $2,778 | $242,220 | $66,580 | $175,640 |
| 2018 | $3,066 | $184,840 | $52,680 | $132,160 |
| 2017 | $2,549 | $184,840 | $52,680 | $132,160 |
| 2016 | $2,415 | $166,110 | $52,680 | $113,430 |
| 2015 | $2,357 | $166,110 | $52,680 | $113,430 |
| 2014 | -- | $161,940 | $52,680 | $109,260 |
| 2013 | -- | $161,940 | $52,680 | $109,260 |
Source: Public Records
Map
Nearby Homes
- 4000 Country Ln NW
- 1981 Chico Way NW
- 3287 Northlake Way NW
- 6116 Kitsap Way Unit 46D
- 6116 Kitsap Way Unit 47A
- 3148 Old Sawmill Place NW
- 3935 NW Fairway Ln Unit 2E
- 0 Old Sawmill Place NW Unit NWM2348102
- 1362 Carr Blvd
- 5149 NW Viewpoint Ln
- 123 NW Windjammer Ct
- 3647 Trails End Rd NW
- 6069 Osprey Cir
- 6006 Osprey Cir
- 7017 Osprey Cir
- 6061 Osprey Cir
- 7010 Cormorant Place
- 5311 Beach Dr
- 1340 Shorewood Dr
- 5245 Erlands Point Rd NW
- 4205 Ridgeway Place
- 2302 Ridgeway Dr
- 4204 Ridgeway Place
- 2298 Ridgeway Dr
- 4173 Ridgeway Place
- 4155 Ridgeway Place
- 4150 Ridgeway Place
- 2474 Ridgeway Dr NW
- 2331 Ridgeway Dr
- 2331 Ridgeway Dr NW
- 2341 Ridgeway Dr
- 4177 Ridgeway Place
- 2294 Ridgeway Dr
- 4079 NW Ridgeway Place
- 4124 Ridgeway Place
- 2327 Ridgeway Dr
- 2228 Ridgeway Dr
- 2327 Ridgeway Dr NW
- 2503 Ridgeway Dr
- 4089 Ridgeway Place