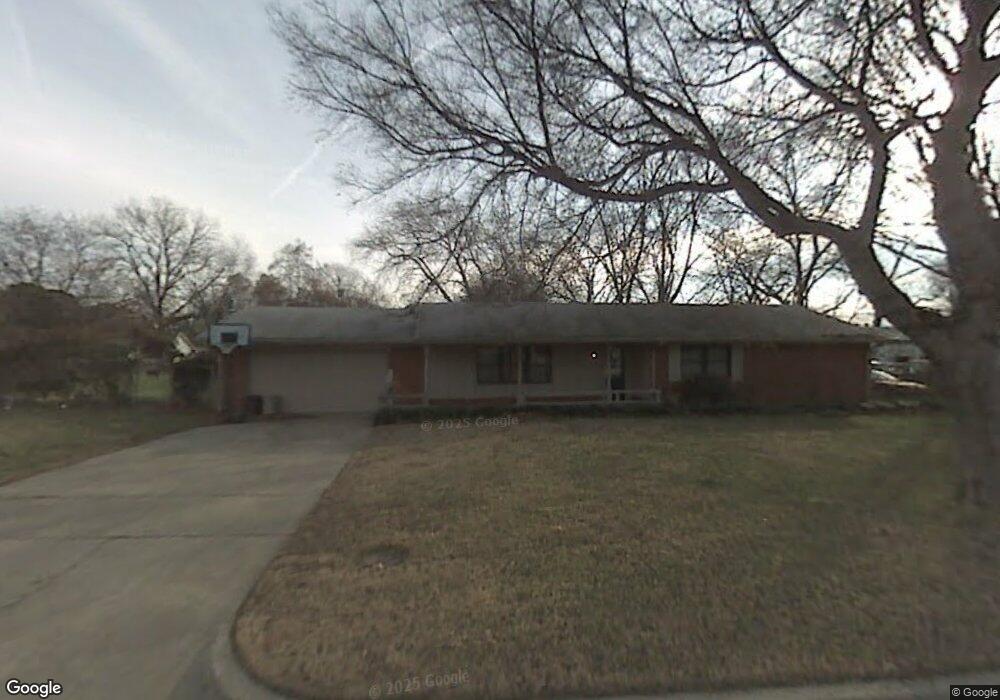
4211 S 35th West Ave Tulsa, OK 74107
Red Fork NeighborhoodEstimated Value: $127,000 - $171,000
--
Bed
2
Baths
1,440
Sq Ft
$106/Sq Ft
Est. Value
About This Home
This home is located at 4211 S 35th West Ave, Tulsa, OK 74107 and is currently estimated at $152,504, approximately $105 per square foot. 4211 S 35th West Ave is a home located in Tulsa County with nearby schools including Clinton West Elementary School, Daniel Webster High School, and St Catherine School.
Ownership History
Date
Name
Owned For
Owner Type
Purchase Details
Closed on
Aug 19, 2021
Sold by
Mueller Todd R and Mueller Deidre L
Bought by
Gomberg William and Yahnitl Roberto
Current Estimated Value
Home Financials for this Owner
Home Financials are based on the most recent Mortgage that was taken out on this home.
Original Mortgage
$89,000
Outstanding Balance
$80,683
Interest Rate
2.7%
Mortgage Type
New Conventional
Estimated Equity
$71,821
Purchase Details
Closed on
Jun 15, 2020
Sold by
Spencer Carl Steve
Bought by
Mueller Todd R and Mueller Deidre L
Purchase Details
Closed on
Oct 13, 2006
Sold by
Sullivan Sharon and Sullivan Robert
Bought by
Spencer Carl Steve
Home Financials for this Owner
Home Financials are based on the most recent Mortgage that was taken out on this home.
Original Mortgage
$63,200
Interest Rate
8.99%
Mortgage Type
Purchase Money Mortgage
Create a Home Valuation Report for This Property
The Home Valuation Report is an in-depth analysis detailing your home's value as well as a comparison with similar homes in the area
Home Values in the Area
Average Home Value in this Area
Purchase History
| Date | Buyer | Sale Price | Title Company |
|---|---|---|---|
| Gomberg William | $98,000 | Oklahoma Secured Title | |
| Mueller Todd R | $2,250 | None Available | |
| Spencer Carl Steve | $79,000 | First American Title & Abstr |
Source: Public Records
Mortgage History
| Date | Status | Borrower | Loan Amount |
|---|---|---|---|
| Open | Gomberg William | $89,000 | |
| Previous Owner | Spencer Carl Steve | $63,200 |
Source: Public Records
Tax History Compared to Growth
Tax History
| Year | Tax Paid | Tax Assessment Tax Assessment Total Assessment is a certain percentage of the fair market value that is determined by local assessors to be the total taxable value of land and additions on the property. | Land | Improvement |
|---|---|---|---|---|
| 2024 | $1,241 | $9,780 | $1,587 | $8,193 |
| 2023 | $1,241 | $10,780 | $1,749 | $9,031 |
| 2022 | $1,304 | $9,780 | $1,587 | $8,193 |
| 2021 | $1,061 | $8,030 | $1,749 | $6,281 |
| 2020 | $1,132 | $8,690 | $1,749 | $6,941 |
| 2019 | $1,191 | $8,690 | $1,749 | $6,941 |
| 2018 | $1,193 | $8,690 | $1,749 | $6,941 |
| 2017 | $1,191 | $8,690 | $1,749 | $6,941 |
| 2016 | $1,167 | $8,690 | $1,749 | $6,941 |
| 2015 | $1,169 | $8,690 | $1,749 | $6,941 |
| 2014 | $1,158 | $8,690 | $1,749 | $6,941 |
Source: Public Records
Map
Nearby Homes
- 3704 W 42nd St
- 4142 S 37th West Ave
- 4136 S 39th West Ave
- 3743 W 45th St
- 4015 W 43rd St
- 4145 S 41st West Ave
- 3768 W 45th St
- 6001 W 41st St S
- 4245 S 28th West Ave
- 4532 S 28th West Ave
- 4307 W 43rd St
- 4727 S 33rd West Ave
- 4216 S 25th West Ave
- 4215 S 25th West Ave
- 4347 W 41st St
- 4214 S 24th West Ave
- 4622 S 26th West Ave
- 4839 S 34th West Ave
- 4813 S 30th West Ave
- 4817 S 30th West Ave
- 4215 S 35th West Ave
- 4219 S 35th West Ave
- 4204 S 35th West Ave
- 4206 S 34th West Ave
- 4151 S 35th West Ave
- 4212 S 34th West Ave
- 4204 S 34th West Ave
- 4216 S 34th West Ave
- 3419 W 42nd Place
- 4147 S 35th West Ave
- 3508 W 42nd St
- 3503 W 42nd Place
- 4220 S 34th West Ave
- 4152 S 34th West Ave
- 4224 S 34th West Ave
- 4143 S 35th West Ave
- 4150 S 35th West Ave
- 3514 W 42nd St
- 4144 S 34th West Ave
- 3509 W 42nd Place