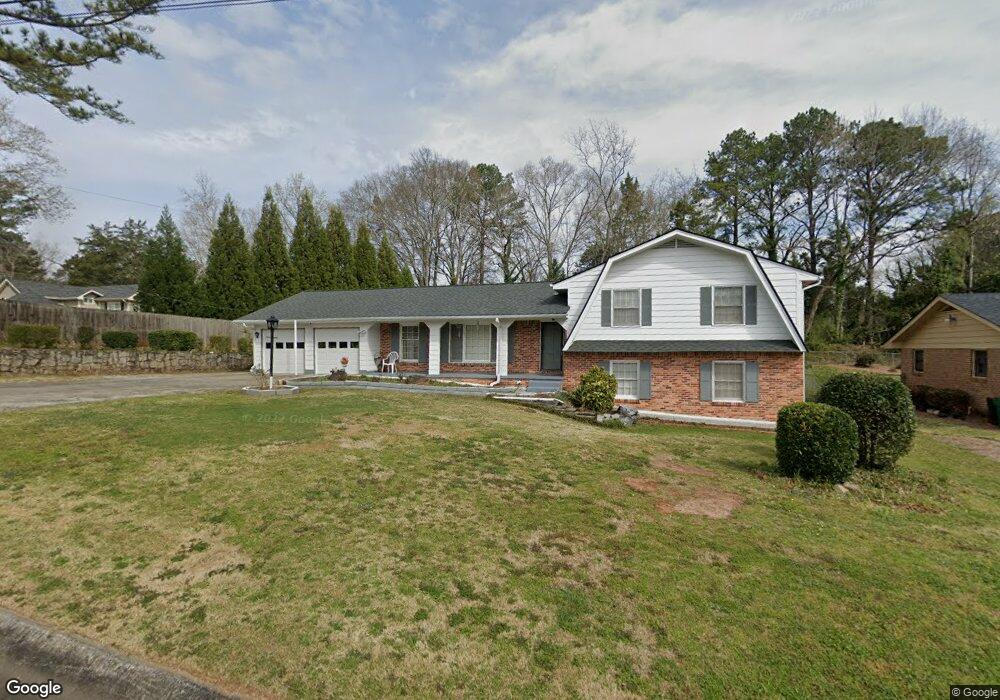
4212 Cavan Dr Unit 2 Stone Mountain, GA 30083
Estimated Value: $319,000 - $357,000
4
Beds
3
Baths
2,868
Sq Ft
$117/Sq Ft
Est. Value
About This Home
This home is located at 4212 Cavan Dr Unit 2, Stone Mountain, GA 30083 and is currently estimated at $334,328, approximately $116 per square foot. 4212 Cavan Dr Unit 2 is a home located in DeKalb County with nearby schools including Jolly Elementary School, Freedom Middle School, and Clarkston High School.
Ownership History
Date
Name
Owned For
Owner Type
Purchase Details
Closed on
Nov 26, 2001
Sold by
Roberts David S
Bought by
Malcolm Charmes and Malcolm Zedna
Current Estimated Value
Home Financials for this Owner
Home Financials are based on the most recent Mortgage that was taken out on this home.
Original Mortgage
$152,793
Interest Rate
6.85%
Mortgage Type
FHA
Purchase Details
Closed on
Nov 28, 1997
Sold by
Leon Jeorge F and Leon Barbara P
Bought by
Roberts David S
Home Financials for this Owner
Home Financials are based on the most recent Mortgage that was taken out on this home.
Original Mortgage
$126,450
Interest Rate
7.38%
Mortgage Type
VA
Purchase Details
Closed on
Jul 26, 1993
Sold by
Mccar Dev Corp
Bought by
Huang Ta Yuan Jui
Home Financials for this Owner
Home Financials are based on the most recent Mortgage that was taken out on this home.
Original Mortgage
$83,250
Interest Rate
4.37%
Create a Home Valuation Report for This Property
The Home Valuation Report is an in-depth analysis detailing your home's value as well as a comparison with similar homes in the area
Home Values in the Area
Average Home Value in this Area
Purchase History
| Date | Buyer | Sale Price | Title Company |
|---|---|---|---|
| Malcolm Charmes | $154,000 | -- | |
| Roberts David S | $124,000 | -- | |
| Huang Ta Yuan Jui | $201,200 | -- |
Source: Public Records
Mortgage History
| Date | Status | Borrower | Loan Amount |
|---|---|---|---|
| Previous Owner | Malcolm Charmes | $152,793 | |
| Previous Owner | Roberts David S | $126,450 | |
| Previous Owner | Huang Ta Yuan Jui | $83,250 |
Source: Public Records
Tax History
| Year | Tax Paid | Tax Assessment Tax Assessment Total Assessment is a certain percentage of the fair market value that is determined by local assessors to be the total taxable value of land and additions on the property. | Land | Improvement |
|---|---|---|---|---|
| 2025 | $947 | $123,800 | $28,000 | $95,800 |
| 2024 | $3,392 | $116,160 | $28,000 | $88,160 |
| 2023 | $3,392 | $121,160 | $28,000 | $93,160 |
Source: Public Records
Map
Nearby Homes
- 4191 Central Dr
- 1050 Rays Rd
- 4274 Cavan Dr
- 1149 Alpine Hills Dr
- 933 Viking Dr
- 904 Abingdon Ct
- 4424 Central Dr
- 4549 Erskine Rd
- 5611 Memorial Dr
- 4245 Parkview Ct Unit H
- 4482 Hunters Terrace
- 4263 Parkview Ct
- 876 Belle Glade Dr
- 4252 Parkview Ct
- 1523 Sagewood Cir
- 4437 Dallis Ct
- 3878 Nielsen Ct
- 4354 Timberlake
- 4362 Timberlake Unit 4362
- 957 Texel Ln Unit 4
- 4220 Cavan Dr Unit 2
- 1015 Rays Rd
- 4228 Cavan Dr
- 998 Dunstan Ln
- 1003 Rays Rd
- 4229 Cavan Dr
- 4236 Cavan Dr Unit 2
- 995 Rays Rd
- 990 Dunstan Ln
- 4237 Cavan Dr
- 4244 Cavan Dr Unit 2
- 1020 Rays Rd
- 1012 Rays Rd
- 985 Dunstan Ln Unit 2
- 4206 Norman Rd
- 1028 Rays Rd
- 982 Dunstan Ln Unit 2
- 1025 Rays Rd
- 1036 Rays Rd
- 4245 Cavan Dr Unit 2
Your Personal Tour Guide
Ask me questions while you tour the home.