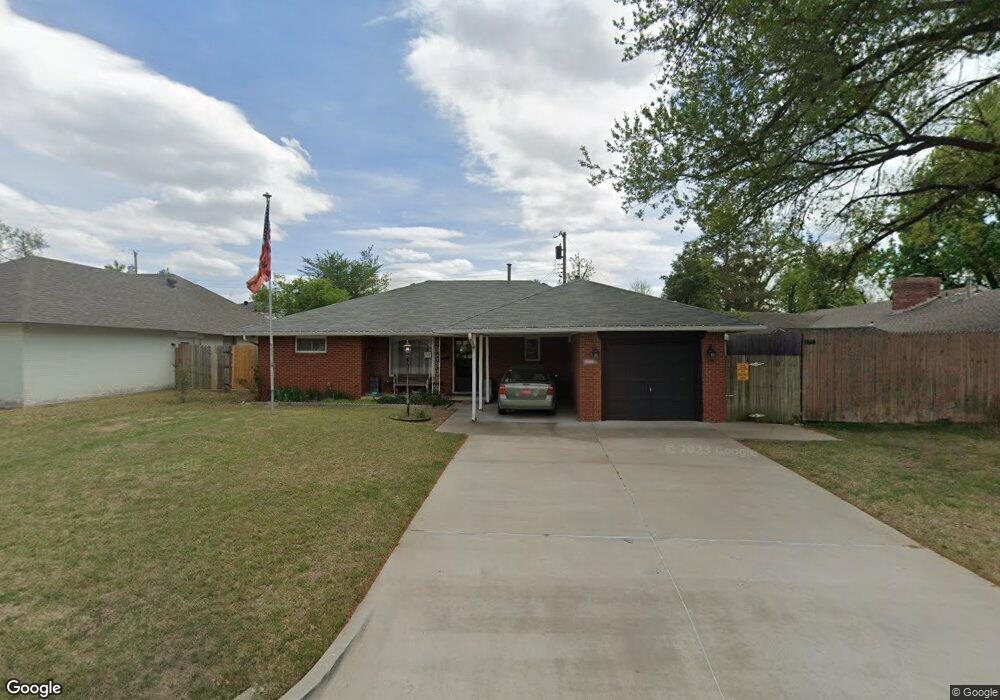
4212 NW 59th St Oklahoma City, OK 73112
Coronado Heights NeighborhoodEstimated Value: $174,000 - $210,000
2
Beds
1
Bath
1,291
Sq Ft
$144/Sq Ft
Est. Value
About This Home
This home is located at 4212 NW 59th St, Oklahoma City, OK 73112 and is currently estimated at $185,988, approximately $144 per square foot. 4212 NW 59th St is a home located in Oklahoma County with nearby schools including Coronado Heights Elementary School, James L. Capps Middle School, and Putnam City High School.
Ownership History
Date
Name
Owned For
Owner Type
Purchase Details
Closed on
Feb 5, 2024
Sold by
Indigo Investment Group Llc
Bought by
Legacy Investment Holdings Llc
Current Estimated Value
Home Financials for this Owner
Home Financials are based on the most recent Mortgage that was taken out on this home.
Original Mortgage
$133,500
Interest Rate
1.2%
Mortgage Type
New Conventional
Purchase Details
Closed on
Feb 2, 2024
Sold by
Wassilak Eric H
Bought by
Indigo Investment Group Llc
Home Financials for this Owner
Home Financials are based on the most recent Mortgage that was taken out on this home.
Original Mortgage
$133,500
Interest Rate
1.2%
Mortgage Type
New Conventional
Purchase Details
Closed on
Feb 14, 2001
Sold by
Wassilak Barbara A and Wassilak Eric H
Bought by
Wassilak Eric H and Wassilak Barbara A
Create a Home Valuation Report for This Property
The Home Valuation Report is an in-depth analysis detailing your home's value as well as a comparison with similar homes in the area
Home Values in the Area
Average Home Value in this Area
Purchase History
| Date | Buyer | Sale Price | Title Company |
|---|---|---|---|
| Legacy Investment Holdings Llc | $128,000 | American Security Title | |
| Indigo Investment Group Llc | $110,000 | Oklahoma City Abstract | |
| Wassilak Eric H | -- | Premier Title |
Source: Public Records
Mortgage History
| Date | Status | Borrower | Loan Amount |
|---|---|---|---|
| Closed | Legacy Investment Holdings Llc | $133,500 |
Source: Public Records
Tax History Compared to Growth
Tax History
| Year | Tax Paid | Tax Assessment Tax Assessment Total Assessment is a certain percentage of the fair market value that is determined by local assessors to be the total taxable value of land and additions on the property. | Land | Improvement |
|---|---|---|---|---|
| 2024 | $1,623 | $14,745 | $2,792 | $11,953 |
| 2023 | $1,623 | $14,315 | $2,332 | $11,983 |
| 2022 | $1,592 | $13,898 | $2,567 | $11,331 |
| 2021 | $1,527 | $13,494 | $2,956 | $10,538 |
| 2020 | $1,472 | $13,101 | $2,998 | $10,103 |
| 2019 | $1,405 | $12,720 | $2,571 | $10,149 |
| 2018 | $1,362 | $12,350 | $0 | $0 |
| 2017 | $1,321 | $11,989 | $2,601 | $9,388 |
| 2016 | $1,252 | $11,427 | $2,586 | $8,841 |
| 2015 | $1,226 | $11,095 | $2,710 | $8,385 |
| 2014 | $1,184 | $11,133 | $2,710 | $8,423 |
Source: Public Records
Map
Nearby Homes
- 4219 NW 58th St
- 4221 NW 60th Place
- 4312 NW 59th St
- 4129 NW 57th St
- 4124 NW 61st Terrace
- 4117 NW 56th Place
- 4405 NW 59th St
- 4401 NW 60th St
- 4009 NW 59th St
- 4061 NW 60th St
- 4312 NW 56th Terrace
- 6200 N Warren Ave
- 4412 NW 57th St
- 4124 NW 56th St
- 5906 N Shawnee Ave
- 5714 N Meridian Ave
- 4129 NW 62nd Terrace
- 5952 N Sapulpa Ave
- 4333 NW 55th St
- 5800 N Meridian Place
- 4208 NW 59th St
- 4233 NW 58th St
- 4213 NW 58th St
- 4204 NW 59th St
- 4209 NW 58th St
- 4213 NW 59th St
- 4217 NW 59th St
- 4209 NW 59th St
- 4205 NW 58th St
- 4200 NW 59th St
- 4221 NW 59th St
- 4228 NW 59th St
- 4205 NW 59th St
- 4225 NW 59th St
- 4201 NW 58th St
- 4228 NW 58th St
- 4136 NW 59th St
- 4201 NW 59th St
- 4229 NW 59th St
- 4212 NW 60th Place