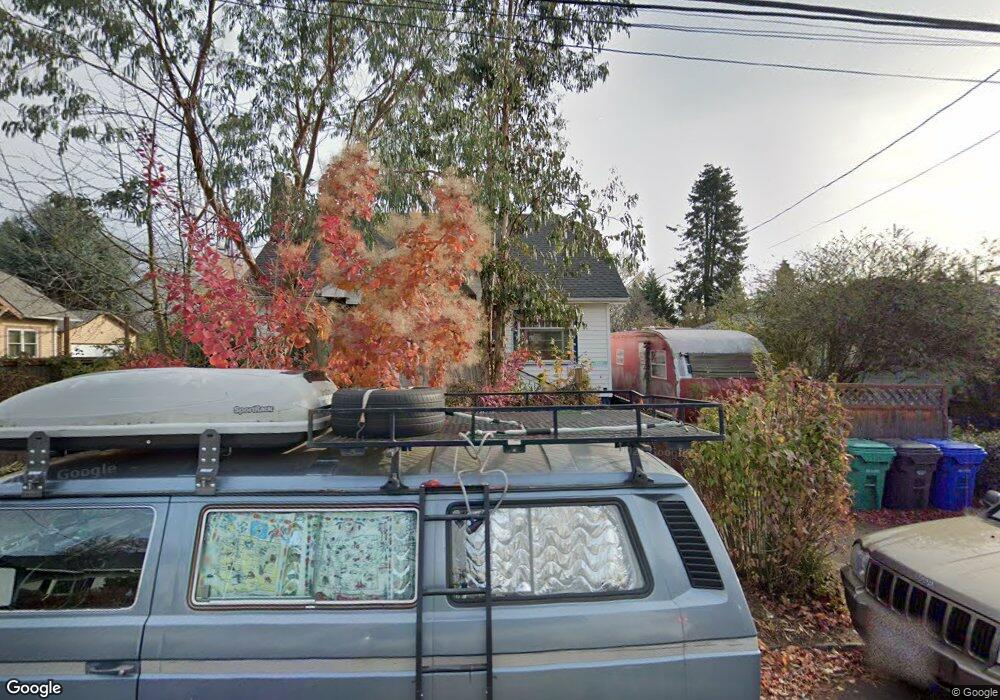
4212 SE 79th Ave Portland, OR 97206
Foster-Powell NeighborhoodEstimated Value: $475,000 - $537,000
3
Beds
2
Baths
1,623
Sq Ft
$318/Sq Ft
Est. Value
About This Home
This home is located at 4212 SE 79th Ave, Portland, OR 97206 and is currently estimated at $515,469, approximately $317 per square foot. 4212 SE 79th Ave is a home located in Multnomah County with nearby schools including Marysville Elementary School, Franklin High School, and Mt. Scott Park Center for Learning.
Ownership History
Date
Name
Owned For
Owner Type
Purchase Details
Closed on
Jun 21, 2006
Sold by
Amundson Jason C
Bought by
Hoof Caroline F
Current Estimated Value
Home Financials for this Owner
Home Financials are based on the most recent Mortgage that was taken out on this home.
Original Mortgage
$104,900
Outstanding Balance
$61,673
Interest Rate
6.57%
Mortgage Type
Purchase Money Mortgage
Estimated Equity
$453,796
Purchase Details
Closed on
Nov 27, 2001
Sold by
Littlefield Todd A
Bought by
Amundson Jason C and Ward Kelly E
Home Financials for this Owner
Home Financials are based on the most recent Mortgage that was taken out on this home.
Original Mortgage
$165,798
Interest Rate
6.63%
Mortgage Type
Purchase Money Mortgage
Purchase Details
Closed on
Sep 29, 1999
Sold by
Littlefield Todd A
Bought by
Littlefield Todd A
Purchase Details
Closed on
Sep 3, 1998
Sold by
Richards Peggy Frances
Bought by
Littlefield Todd
Home Financials for this Owner
Home Financials are based on the most recent Mortgage that was taken out on this home.
Original Mortgage
$141,900
Interest Rate
6.93%
Mortgage Type
Purchase Money Mortgage
Create a Home Valuation Report for This Property
The Home Valuation Report is an in-depth analysis detailing your home's value as well as a comparison with similar homes in the area
Home Values in the Area
Average Home Value in this Area
Purchase History
| Date | Buyer | Sale Price | Title Company |
|---|---|---|---|
| Hoof Caroline F | $256,400 | Ticor Title Insurance Compan | |
| Amundson Jason C | $168,400 | Pacific Nw Title | |
| Littlefield Todd A | -- | -- | |
| Littlefield Todd A | -- | -- | |
| Littlefield Todd | $157,700 | Pacific Nw Title |
Source: Public Records
Mortgage History
| Date | Status | Borrower | Loan Amount |
|---|---|---|---|
| Open | Hoof Caroline F | $104,900 | |
| Previous Owner | Amundson Jason C | $165,798 | |
| Previous Owner | Littlefield Todd | $141,900 |
Source: Public Records
Tax History Compared to Growth
Tax History
| Year | Tax Paid | Tax Assessment Tax Assessment Total Assessment is a certain percentage of the fair market value that is determined by local assessors to be the total taxable value of land and additions on the property. | Land | Improvement |
|---|---|---|---|---|
| 2024 | $5,759 | $215,250 | -- | -- |
| 2023 | $5,538 | $208,990 | $0 | $0 |
| 2022 | $5,418 | $202,910 | $0 | $0 |
| 2021 | $5,326 | $197,000 | $0 | $0 |
| 2020 | $4,886 | $191,270 | $0 | $0 |
| 2019 | $4,707 | $185,700 | $0 | $0 |
| 2018 | $4,569 | $180,300 | $0 | $0 |
| 2017 | $4,379 | $175,050 | $0 | $0 |
| 2016 | $4,007 | $169,960 | $0 | $0 |
| 2015 | $3,902 | $165,010 | $0 | $0 |
| 2014 | $3,843 | $160,210 | $0 | $0 |
Source: Public Records
Map
Nearby Homes
- 4040 SE 79th Ave
- 8019 SE Boise St
- 3815 SE 76th Ave Unit B
- 0 SE 83rd Ave Unit 23, 24 346833993
- 4630 SE 75th Ave
- 4230 SE 73rd Ave
- 7309 SE Holgate Blvd
- 8027 SE Rhone St
- 4318 SE 72nd Ave
- 3636 SE 74th Ave
- 3601 SE 76th Ave
- 8305 SE Rhone St
- 4629 SE 73rd Ave
- 4504 SE 85th Ave
- 7935 SE Raymond St
- 4822 SE 73rd Ave Unit 4824
- 4811 SE 84th Ave
- 8451 SE Bush St
- 3801 SE 72nd Ave
- 8312 SE Liebe St
- 4226 SE 79th Ave
- 4234 SE 79th Ave
- 4200 SE 79th Ave
- 4154 SE 79th Ave
- 4160 SE 79th Ave Unit B
- 4160 SE 79th Ave
- 4232 SE 79th Ave
- 4230 SE 79th Ave
- 4240 SE 79th Ave
- 4148 SE 79th Ave
- 4205 SE 80th Ave
- 4209 SE 80th Ave
- 4300 SE 79th Ave
- 4155 SE 79th Ave
- 4231 SE 79th Ave
- 4142 SE 79th Ave
- 4215 SE 80th Ave
- 4247 SE 79th Ave Unit 4247
- 4143 SE 79th Ave
- 4219 SE 80th Ave