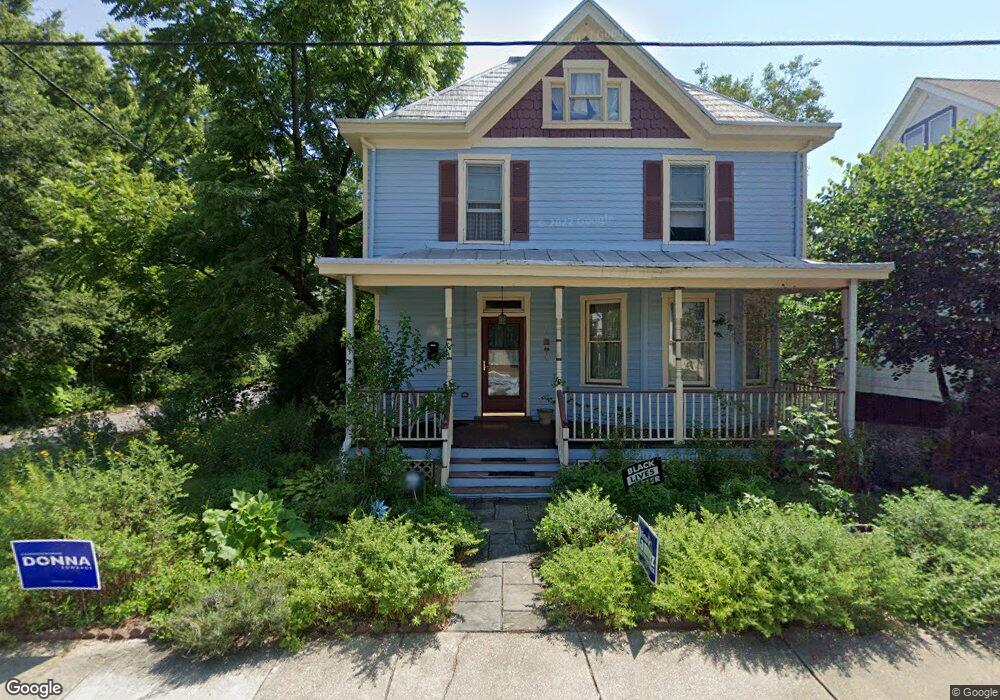
4213 34th St Mount Rainier, MD 20712
Estimated Value: $492,101 - $571,000
--
Bed
2
Baths
1,672
Sq Ft
$322/Sq Ft
Est. Value
About This Home
This home is located at 4213 34th St, Mount Rainier, MD 20712 and is currently estimated at $538,025, approximately $321 per square foot. 4213 34th St is a home located in Prince George's County with nearby schools including Mt Rainier Elementary School, Hyattsville Middle School, and Northwestern High School.
Ownership History
Date
Name
Owned For
Owner Type
Purchase Details
Closed on
Nov 4, 2003
Sold by
Allen Shanise
Bought by
Tarlau James J and Tarlau Jodi Beder
Current Estimated Value
Purchase Details
Closed on
Mar 10, 2000
Sold by
Homecomings Fin Network Inc
Bought by
Allen Shanise
Purchase Details
Closed on
Jun 4, 1999
Sold by
Thomas Eugene
Bought by
Homecomings Fin Network Inc
Purchase Details
Closed on
Mar 13, 1998
Sold by
Corso Dominick J
Bought by
Thomas Eugene
Create a Home Valuation Report for This Property
The Home Valuation Report is an in-depth analysis detailing your home's value as well as a comparison with similar homes in the area
Home Values in the Area
Average Home Value in this Area
Purchase History
| Date | Buyer | Sale Price | Title Company |
|---|---|---|---|
| Tarlau James J | $203,000 | -- | |
| Allen Shanise | $91,500 | -- | |
| Homecomings Fin Network Inc | $81,600 | -- | |
| Thomas Eugene | $158,000 | -- |
Source: Public Records
Tax History Compared to Growth
Tax History
| Year | Tax Paid | Tax Assessment Tax Assessment Total Assessment is a certain percentage of the fair market value that is determined by local assessors to be the total taxable value of land and additions on the property. | Land | Improvement |
|---|---|---|---|---|
| 2024 | $7,571 | $457,100 | $135,500 | $321,600 |
| 2023 | $7,018 | $443,333 | $0 | $0 |
| 2022 | $7,870 | $429,567 | $0 | $0 |
| 2021 | $1,185 | $415,800 | $100,200 | $315,600 |
| 2020 | $11,518 | $390,767 | $0 | $0 |
| 2019 | $5,343 | $365,733 | $0 | $0 |
| 2018 | $10,010 | $340,700 | $75,200 | $265,500 |
| 2017 | $1,431 | $289,500 | $0 | $0 |
| 2016 | -- | $238,300 | $0 | $0 |
| 2015 | $4,660 | $187,100 | $0 | $0 |
| 2014 | $4,660 | $187,100 | $0 | $0 |
Source: Public Records
Map
Nearby Homes