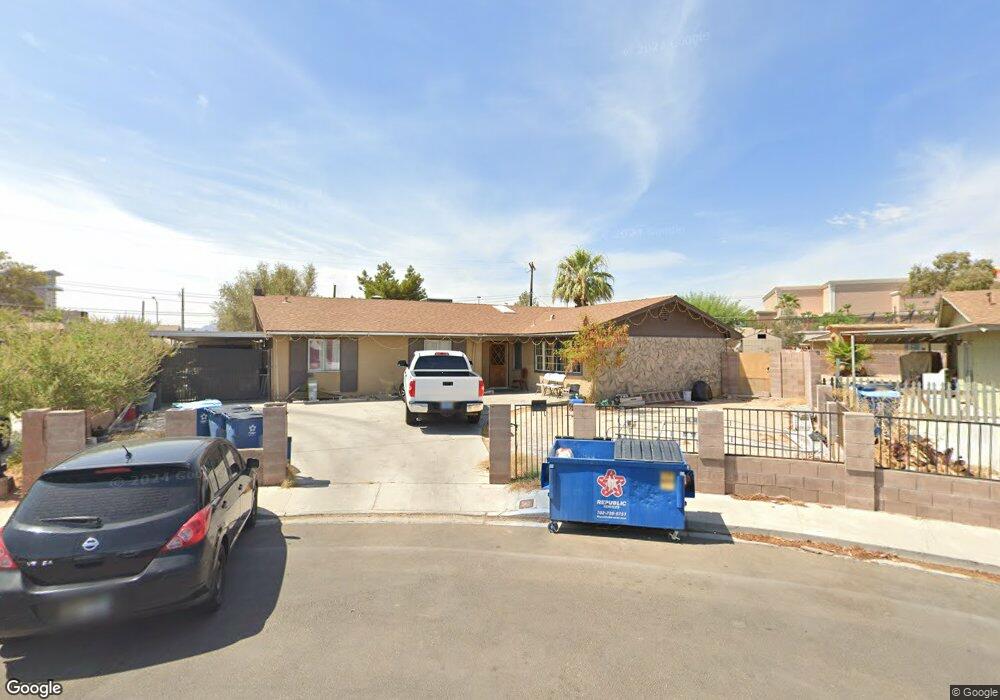
4213 Canal Cir Unit 2 Las Vegas, NV 89122
Estimated Value: $349,000 - $442,000
4
Beds
2
Baths
2,351
Sq Ft
$176/Sq Ft
Est. Value
About This Home
This home is located at 4213 Canal Cir Unit 2, Las Vegas, NV 89122 and is currently estimated at $412,829, approximately $175 per square foot. 4213 Canal Cir Unit 2 is a home located in Clark County with nearby schools including Cynthia Cunningham Elementary School, Francis H Cortney Junior High School, and Chaparral High School.
Ownership History
Date
Name
Owned For
Owner Type
Purchase Details
Closed on
May 13, 2011
Sold by
Washington Federal Savings
Bought by
Chen Peter Che Nan
Current Estimated Value
Purchase Details
Closed on
Jan 12, 2011
Sold by
Mcdonald Homer C and Mcdonald Linda L
Bought by
Washington Federal Savings
Purchase Details
Closed on
Jul 8, 2004
Sold by
Mcdonald Anthony R
Bought by
Mcdonald Homer C and Mcdonald Linda L
Home Financials for this Owner
Home Financials are based on the most recent Mortgage that was taken out on this home.
Original Mortgage
$162,000
Interest Rate
6.27%
Mortgage Type
Unknown
Purchase Details
Closed on
Aug 20, 2002
Sold by
Mcdonald Sally Ann
Bought by
Mcdonald Anthony R
Purchase Details
Closed on
Jul 29, 2002
Sold by
The Calhoun 1998 Trust
Bought by
Mcdonald Anthony R
Purchase Details
Closed on
Feb 18, 1999
Sold by
Calhoun Delores J and Sayers Delores J
Bought by
Calhoun Delores J and Calhoun 1998 Trust
Purchase Details
Closed on
Nov 19, 1998
Sold by
Calhoun Delores J
Bought by
Calhoun Delores J and Calhoun 1998 Trust
Create a Home Valuation Report for This Property
The Home Valuation Report is an in-depth analysis detailing your home's value as well as a comparison with similar homes in the area
Home Values in the Area
Average Home Value in this Area
Purchase History
| Date | Buyer | Sale Price | Title Company |
|---|---|---|---|
| Chen Peter Che Nan | $65,000 | Nevada Title Las Vegas | |
| Washington Federal Savings | $204,109 | Accommodation | |
| Mcdonald Homer C | $170,000 | Chicago Title | |
| Mcdonald Anthony R | $150,000 | Fidelity National Title | |
| Mcdonald Anthony R | $150,000 | Fidelity National Title | |
| Calhoun Delores J | -- | -- | |
| Calhoun Delores J | -- | -- |
Source: Public Records
Mortgage History
| Date | Status | Borrower | Loan Amount |
|---|---|---|---|
| Previous Owner | Mcdonald Homer C | $162,000 |
Source: Public Records
Tax History Compared to Growth
Tax History
| Year | Tax Paid | Tax Assessment Tax Assessment Total Assessment is a certain percentage of the fair market value that is determined by local assessors to be the total taxable value of land and additions on the property. | Land | Improvement |
|---|---|---|---|---|
| 2025 | $1,152 | $60,174 | $25,900 | $34,274 |
| 2024 | $1,067 | $60,174 | $25,900 | $34,274 |
| 2023 | $1,067 | $60,875 | $30,100 | $30,775 |
| 2022 | $988 | $50,764 | $23,100 | $27,664 |
| 2021 | $915 | $46,987 | $21,350 | $25,637 |
| 2020 | $847 | $44,890 | $19,950 | $24,940 |
| 2019 | $794 | $40,482 | $16,450 | $24,032 |
| 2018 | $758 | $36,943 | $14,350 | $22,593 |
| 2017 | $1,079 | $36,795 | $14,350 | $22,445 |
| 2016 | $710 | $33,326 | $9,100 | $24,226 |
| 2015 | $708 | $27,495 | $7,700 | $19,795 |
| 2014 | $686 | $22,867 | $5,250 | $17,617 |
Source: Public Records
Map
Nearby Homes
- 4210 Canal Cir
- 4289 Chocolate St
- 5461 Palisades Quad Ave
- 4241 S Nellis Blvd
- 4991 Powell Ave
- 5525 Criollo Dr
- 4951 Plata Del Sol Dr
- 5536 Criollo Dr
- 5432 Barstow Ct
- 5249 Sun Valley Dr
- 4559 S Nellis Blvd
- 4567 S Nellis Blvd
- 5303 E Twain Ave Unit 70
- 5303 E Twain Ave Unit 250
- 5303 E Twain Ave Unit 171
- 5303 E Twain Ave Unit 33
- 4831 Monterrey Ave
- 5149 Sun Valley Dr
- 5093 Sun Valley Dr
- 5552 Jackpot Winner Ln Unit 101