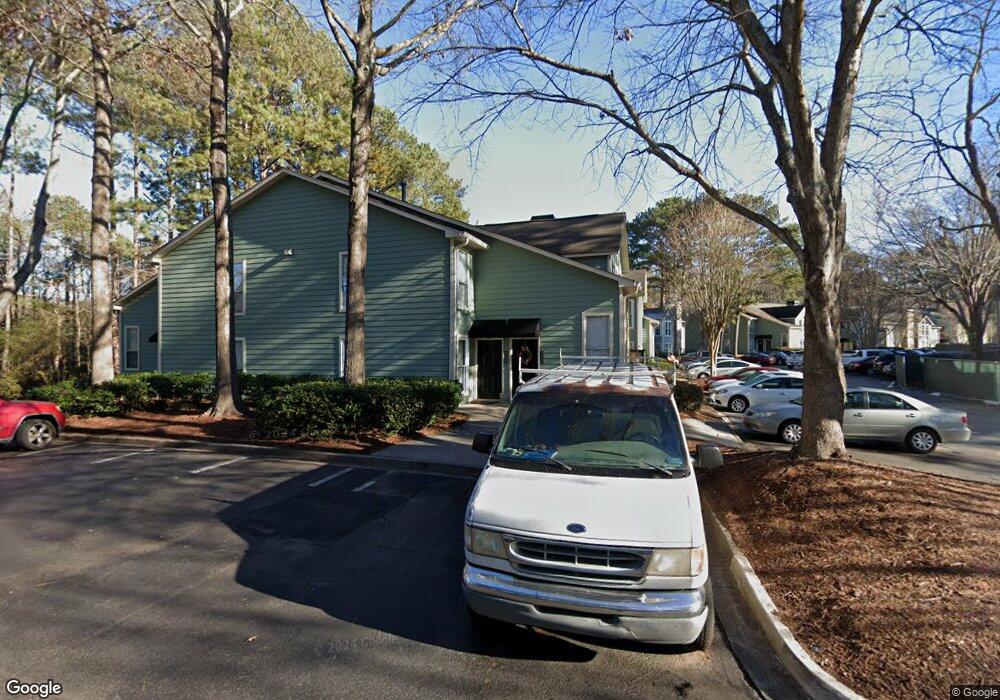
4213 Canyon Point Cir Unit 1316 Roswell, GA 30076
Estimated Value: $240,122 - $254,000
2
Beds
2
Baths
1,316
Sq Ft
$188/Sq Ft
Est. Value
About This Home
This home is located at 4213 Canyon Point Cir Unit 1316, Roswell, GA 30076 and is currently estimated at $247,531, approximately $188 per square foot. 4213 Canyon Point Cir Unit 1316 is a home located in Fulton County with nearby schools including River Eves Elementary School, Holcomb Bridge Middle School, and Centennial High School.
Ownership History
Date
Name
Owned For
Owner Type
Purchase Details
Closed on
Nov 10, 2011
Sold by
4213 Canyon Point Circle L
Bought by
Richburg Jackie
Current Estimated Value
Home Financials for this Owner
Home Financials are based on the most recent Mortgage that was taken out on this home.
Original Mortgage
$74,073
Outstanding Balance
$49,847
Interest Rate
3.75%
Mortgage Type
FHA
Estimated Equity
$197,684
Purchase Details
Closed on
Apr 29, 2011
Sold by
Hud & Housing Of Urban Dev
Bought by
4213 Canyon Point Llc
Purchase Details
Closed on
Apr 6, 2010
Sold by
Akins Cheri S
Bought by
Wells Fargo Bk Na
Purchase Details
Closed on
Dec 1, 1998
Sold by
Kline Helen D
Bought by
Akins Cheri S
Home Financials for this Owner
Home Financials are based on the most recent Mortgage that was taken out on this home.
Original Mortgage
$87,950
Interest Rate
6.77%
Mortgage Type
FHA
Purchase Details
Closed on
Mar 29, 1996
Sold by
Hall Lynn
Bought by
Kline Helen D
Create a Home Valuation Report for This Property
The Home Valuation Report is an in-depth analysis detailing your home's value as well as a comparison with similar homes in the area
Home Values in the Area
Average Home Value in this Area
Purchase History
| Date | Buyer | Sale Price | Title Company |
|---|---|---|---|
| Richburg Jackie | $76,000 | -- | |
| 4213 Canyon Point Llc | -- | -- | |
| Wells Fargo Bk Na | $82,616 | -- | |
| Akins Cheri S | $90,700 | -- | |
| Kline Helen D | $78,000 | -- |
Source: Public Records
Mortgage History
| Date | Status | Borrower | Loan Amount |
|---|---|---|---|
| Open | Richburg Jackie | $74,073 | |
| Previous Owner | Akins Cheri S | $87,950 | |
| Closed | Kline Helen D | $0 |
Source: Public Records
Tax History Compared to Growth
Tax History
| Year | Tax Paid | Tax Assessment Tax Assessment Total Assessment is a certain percentage of the fair market value that is determined by local assessors to be the total taxable value of land and additions on the property. | Land | Improvement |
|---|---|---|---|---|
| 2025 | $284 | $88,360 | $15,040 | $73,320 |
| 2023 | $3,090 | $109,480 | $14,360 | $95,120 |
| 2022 | $794 | $84,360 | $16,760 | $67,600 |
| 2021 | $974 | $74,880 | $9,480 | $65,400 |
| 2020 | $982 | $66,240 | $9,800 | $56,440 |
| 2019 | $200 | $63,040 | $8,120 | $54,920 |
| 2018 | $901 | $47,800 | $4,760 | $43,040 |
| 2017 | $739 | $37,640 | $4,160 | $33,480 |
| 2016 | $732 | $37,640 | $4,160 | $33,480 |
| 2015 | $940 | $37,640 | $4,160 | $33,480 |
| 2014 | $579 | $31,640 | $4,040 | $27,600 |
Source: Public Records
Map
Nearby Homes
- 1115 Canyon Point Cir
- 3209 Canyon Point Cir
- 3001 Canyon Point Cir
- 920 Renaissance Way
- 140 Glen Holly Dr
- 110 River Terrace Point
- 9156 Branch Valley Way
- 1820 Branch Valley Dr
- 680 Branch Valley Ct
- 8320 Sentinae Chase Dr
- 945 Club Chase Ct
- 1985 Branch Valley Dr
- 3040 Gray Hawk Ln
- 3010 Kara Ct
- 3020 Kara Ct
- 8705 River Bluff Ln
- 9110 Twelvestones Dr
- 4040 Declaration Dr
- 325 Riverhall Ct Unit 5
- 420 Hackberry Ct Unit 1
- 4213 Canyon Point Cir Unit 4213
- 4207 Canyon Point Cir
- 4215 Canyon Point Cir
- 4205 Canyon Point Cir
- 4209 Canyon Point Cir Unit 4209
- 4201 Canyon Point Cir
- 4109 Canyon Point Cir Unit 4109
- 4109 Canyon Point Cir
- 4109 Canyon Point Cir
- 4109 Canyon Point Cir
- 4111 Canyon Point Cir
- 1000 Canyon Point Cir Unit N/a
- 1000 Canyon Point Cir
- 4115 Canyon Point Cir
- 4115 Canyon Point Cir Unit 4115
- 4115 Canyon Point Cir
- 1004 Canyon Point Cir
- 4105 Canyon Point Cir
- 1008 Canyon Point Cir
- 1006 Canyon Point Cir