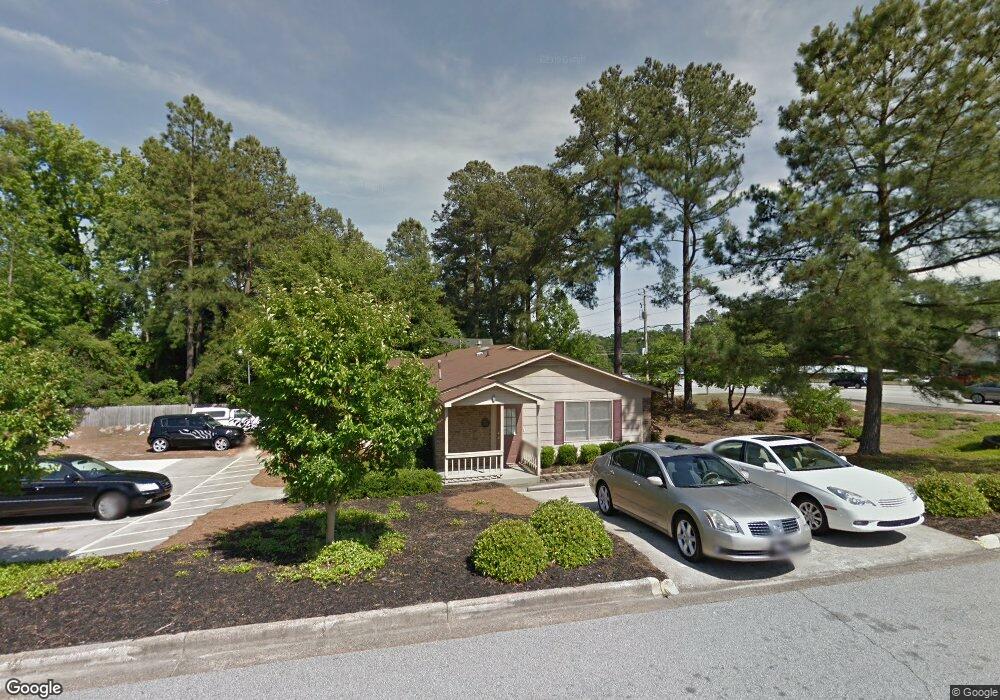
4213 Columbia Rd Augusta, GA 30907
Estimated Value: $313,633
--
Bed
2
Baths
2,066
Sq Ft
$152/Sq Ft
Est. Value
About This Home
This home is located at 4213 Columbia Rd, Augusta, GA 30907 and is currently estimated at $313,633, approximately $151 per square foot. 4213 Columbia Rd is a home located in Columbia County with nearby schools including Northmore Elementary School, Jupiter Elementary School, and Martinez Elementary School.
Ownership History
Date
Name
Owned For
Owner Type
Purchase Details
Closed on
Oct 26, 2023
Sold by
Blake Recreations Lp
Bought by
Acumen Capital Llc
Current Estimated Value
Purchase Details
Closed on
Dec 22, 2022
Sold by
Coursey Brian
Bought by
Blake Recreations Lp
Home Financials for this Owner
Home Financials are based on the most recent Mortgage that was taken out on this home.
Original Mortgage
$293,211
Interest Rate
6.58%
Mortgage Type
Mortgage Modification
Purchase Details
Closed on
Jul 29, 2021
Sold by
Reid David E
Bought by
Doss Adam J and Doss Laura E
Home Financials for this Owner
Home Financials are based on the most recent Mortgage that was taken out on this home.
Original Mortgage
$244,000
Interest Rate
2.9%
Mortgage Type
Commercial
Purchase Details
Closed on
Aug 12, 2019
Sold by
Reid David E
Bought by
Reid David E and Reid Liv Trust
Create a Home Valuation Report for This Property
The Home Valuation Report is an in-depth analysis detailing your home's value as well as a comparison with similar homes in the area
Home Values in the Area
Average Home Value in this Area
Purchase History
| Date | Buyer | Sale Price | Title Company |
|---|---|---|---|
| Acumen Capital Llc | $300,000 | -- | |
| Blake Recreations Lp | $285,000 | -- | |
| Doss Adam J | $305,000 | -- | |
| Reid David E | -- | -- |
Source: Public Records
Mortgage History
| Date | Status | Borrower | Loan Amount |
|---|---|---|---|
| Previous Owner | Blake Recreations Lp | $293,211 | |
| Previous Owner | Doss Adam J | $244,000 |
Source: Public Records
Tax History Compared to Growth
Tax History
| Year | Tax Paid | Tax Assessment Tax Assessment Total Assessment is a certain percentage of the fair market value that is determined by local assessors to be the total taxable value of land and additions on the property. | Land | Improvement |
|---|---|---|---|---|
| 2025 | $2,359 | $98,949 | $45,599 | $53,350 |
| 2024 | $2,537 | $101,574 | $45,599 | $55,975 |
| 2023 | $2,537 | $77,053 | $45,599 | $31,454 |
| 2022 | $1,959 | $75,431 | $45,599 | $29,832 |
| 2021 | $2,159 | $79,476 | $45,599 | $33,877 |
| 2020 | $2,206 | $79,507 | $44,641 | $34,866 |
| 2019 | $1,940 | $69,900 | $44,641 | $25,259 |
| 2018 | $1,992 | $71,565 | $44,641 | $26,924 |
| 2017 | $1,965 | $70,348 | $44,641 | $25,707 |
| 2016 | $1,917 | $71,166 | $44,617 | $26,549 |
| 2015 | $1,778 | $65,891 | $39,137 | $26,754 |
| 2014 | $1,943 | $71,091 | $39,137 | $31,954 |
Source: Public Records
Map
Nearby Homes
- 102 Cokesbury Ct
- 117 Lenox Place
- 117 Lenox Dr
- 116 Springlakes Dr
- 126 Wood Creek Dr
- 149 Woodland Dr
- 222 Oakridge Dr
- 219 Stonington Dr
- 228 Woodland Dr
- 4045 Dowling Dr
- 4179 Heathcliff Dr
- 226 Ashley Cir
- 4178 Heathcliff Dr
- 4182 Knollcrest Cir N Unit N.
- 114 W Lynne Dr
- 4222 Green Ivy Cir
- 4212 Knollcrest Cir S
- 110 Redbud Ln
- 155 Ashbyrne Dr
- 4080 Harden Ct
- 4211 Columbia Rd
- 101 Cokesbury Ct
- 103 Cokesbury Ct
- 104 Cokesbury Ct
- 108 Lenox Place
- 4217 Columbia Rd
- 106 Lenox Place
- 105 Cokesbury Ct
- 106 Cokesbury Ct
- 120 Buckboard Dr
- 110 Lenox Place
- 107 Cokesbury Ct
- 4214 Columbia Rd
- 122 Buckboard Dr
- 104 Lenox Place
- 108 Cokesbury Ct
- 4216 Columbia Rd
- 4204 Columbia Rd
- 112 Lenox Place
- 102 Wood Creek Dr