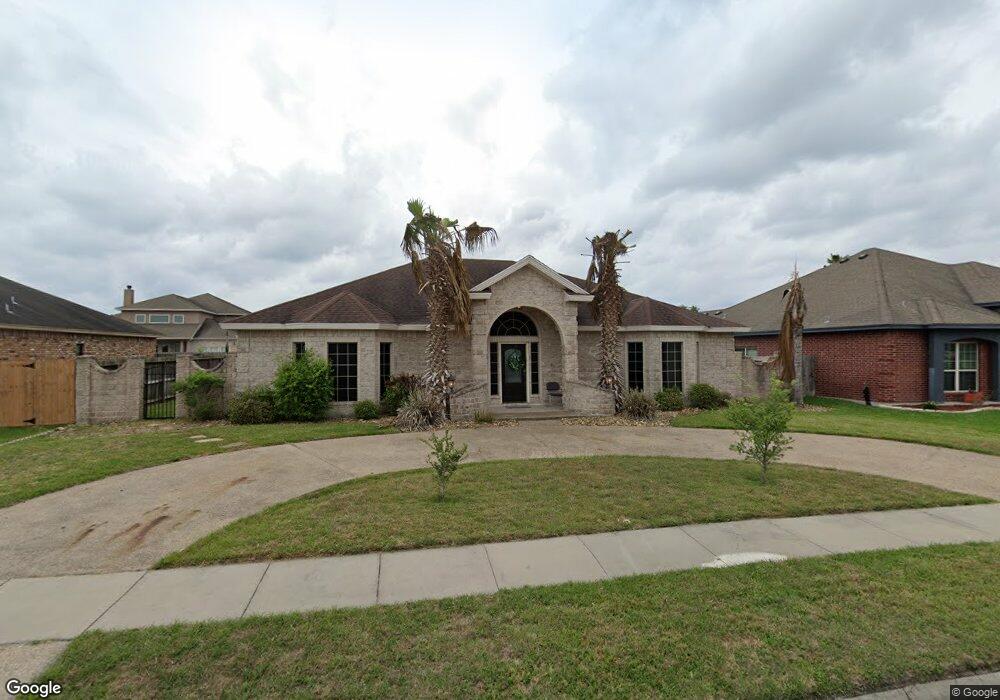
4213 Lake Apache Dr Corpus Christi, TX 78413
Southside NeighborhoodEstimated Value: $349,282 - $517,000
3
Beds
4
Baths
2,906
Sq Ft
$147/Sq Ft
Est. Value
About This Home
This home is located at 4213 Lake Apache Dr, Corpus Christi, TX 78413 and is currently estimated at $428,071, approximately $147 per square foot. 4213 Lake Apache Dr is a home located in Nueces County with nearby schools including Jones Elementary School, Grant Middle School, and Carroll High School.
Ownership History
Date
Name
Owned For
Owner Type
Purchase Details
Closed on
Mar 10, 2015
Sold by
Hernandez Paul Jose
Bought by
Herrman Gregory
Current Estimated Value
Home Financials for this Owner
Home Financials are based on the most recent Mortgage that was taken out on this home.
Original Mortgage
$228,076
Outstanding Balance
$175,005
Interest Rate
3.73%
Mortgage Type
Purchase Money Mortgage
Estimated Equity
$253,066
Purchase Details
Closed on
Dec 2, 2009
Sold by
Fannie Mae
Bought by
Hernandez Paul Jose
Purchase Details
Closed on
Sep 1, 2009
Sold by
Denure Soledad and Denure David A
Bought by
Federal National Mortgage Association
Purchase Details
Closed on
Apr 25, 2005
Sold by
F & B Homes Llp
Bought by
Denure David A
Home Financials for this Owner
Home Financials are based on the most recent Mortgage that was taken out on this home.
Original Mortgage
$333,700
Interest Rate
5.89%
Mortgage Type
New Conventional
Create a Home Valuation Report for This Property
The Home Valuation Report is an in-depth analysis detailing your home's value as well as a comparison with similar homes in the area
Home Values in the Area
Average Home Value in this Area
Purchase History
| Date | Buyer | Sale Price | Title Company |
|---|---|---|---|
| Herrman Gregory | -- | None Available | |
| Hernandez Paul Jose | -- | Independence Title Company | |
| Federal National Mortgage Association | $281,759 | None Available | |
| Denure David A | -- | First American Title Ins |
Source: Public Records
Mortgage History
| Date | Status | Borrower | Loan Amount |
|---|---|---|---|
| Open | Herrman Gregory | $228,076 | |
| Previous Owner | Denure David A | $333,700 |
Source: Public Records
Tax History Compared to Growth
Tax History
| Year | Tax Paid | Tax Assessment Tax Assessment Total Assessment is a certain percentage of the fair market value that is determined by local assessors to be the total taxable value of land and additions on the property. | Land | Improvement |
|---|---|---|---|---|
| 2025 | $8,633 | $395,600 | $86,832 | $308,768 |
| 2024 | $8,633 | $396,980 | $48,240 | $348,740 |
| 2023 | $8,760 | $411,021 | $48,240 | $362,781 |
| 2022 | $8,767 | $352,373 | $48,240 | $304,133 |
| 2021 | $8,540 | $326,628 | $48,240 | $278,388 |
| 2020 | $8,422 | $321,325 | $48,240 | $273,085 |
| 2019 | $8,357 | $316,086 | $48,240 | $267,846 |
| 2018 | $7,872 | $310,904 | $48,240 | $262,664 |
| 2017 | $7,712 | $305,489 | $48,240 | $257,249 |
| 2016 | $7,569 | $299,829 | $48,240 | $251,589 |
| 2015 | $7,066 | $302,341 | $48,240 | $254,101 |
| 2014 | $7,066 | $277,840 | $48,240 | $229,600 |
Source: Public Records
Map
Nearby Homes
- 4201 Lake Apache Dr
- 7461 Lake Micala Dr
- 7445 Lake Micala Dr
- 7617 Kings Lake
- 4101 Saddlewood
- 7650 Kings Lake
- 4301 Lake Michigan Dr
- 4237 Ridge View Dr
- 23 Great Lakes Dr
- 7310 Twilight Ridge Dr
- 4446 Lake Superior Dr
- 7437 Lake Neuchatel Dr
- 7506 Bistineau Dr
- 4506 Silver Hollow Dr
- 1 Great Lakes Dr
- 4513 Ammer Lake Dr
- 4537 Silver Hollow Dr
- 4514 Stony Creek Dr
- 7434 Lake Como Dr
- 4530 Megal Dr
- 4217 Lake Apache Dr
- 4209 Lake Apache Dr
- 4214 Pontchartrain Dr
- 4210 Pontchartrain Dr
- 4221 Lake Apache Dr
- 4205 Lake Apache Dr
- 4218 Pontchartrain Dr
- 4218 Pontchartrain Dr
- 4214 Lake Apache Dr
- 4218 Lake Apache Dr
- 4210 Lake Apache Dr
- 4206 Pontchartrain Dr
- 4222 Lake Apache Dr
- 4222 4222 Dr
- 4225 Lake Apache Dr
- 4204 Pontchartrain Dr
- 4226 Lake Apache Dr
- 4222 Pontchartrain Dr
- 4202 Lake Apache Dr
- 4226 Pontchartrain Dr