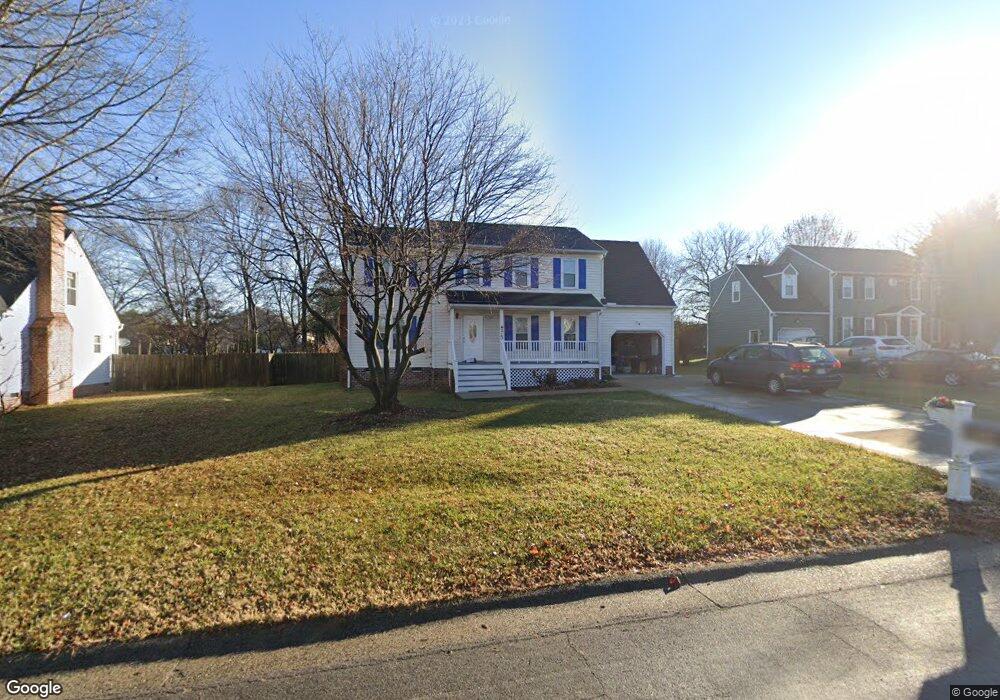
4213 Lanver Ln Henrico, VA 23294
Echo Lake NeighborhoodEstimated Value: $384,000 - $449,178
4
Beds
3
Baths
1,872
Sq Ft
$227/Sq Ft
Est. Value
About This Home
This home is located at 4213 Lanver Ln, Henrico, VA 23294 and is currently estimated at $425,295, approximately $227 per square foot. 4213 Lanver Ln is a home located in Henrico County with nearby schools including Longan Elementary School, Hungary Creek Middle School, and Tucker High School.
Ownership History
Date
Name
Owned For
Owner Type
Purchase Details
Closed on
Oct 22, 2020
Sold by
Hang Quang H
Bought by
Hoang Thu M
Current Estimated Value
Home Financials for this Owner
Home Financials are based on the most recent Mortgage that was taken out on this home.
Original Mortgage
$110,000
Outstanding Balance
$78,890
Interest Rate
2.8%
Mortgage Type
New Conventional
Estimated Equity
$346,405
Purchase Details
Closed on
Oct 8, 2009
Sold by
Wells Fargo Bank
Bought by
Hang Quang H
Home Financials for this Owner
Home Financials are based on the most recent Mortgage that was taken out on this home.
Original Mortgage
$136,000
Interest Rate
4.86%
Mortgage Type
New Conventional
Purchase Details
Closed on
Jul 21, 2009
Sold by
Professional Foreclosure Corp
Bought by
Wells Fargo Bank
Purchase Details
Closed on
Oct 2, 2001
Sold by
Carter Mark P
Bought by
Chan Kun S and Chan Sarun C
Create a Home Valuation Report for This Property
The Home Valuation Report is an in-depth analysis detailing your home's value as well as a comparison with similar homes in the area
Home Values in the Area
Average Home Value in this Area
Purchase History
| Date | Buyer | Sale Price | Title Company |
|---|---|---|---|
| Hoang Thu M | -- | None Available | |
| Hang Quang H | $170,000 | -- | |
| Wells Fargo Bank | $251,916 | -- | |
| Chan Kun S | $150,675 | -- |
Source: Public Records
Mortgage History
| Date | Status | Borrower | Loan Amount |
|---|---|---|---|
| Open | Hoang Thu M | $110,000 | |
| Previous Owner | Hang Quang H | $136,000 |
Source: Public Records
Tax History Compared to Growth
Tax History
| Year | Tax Paid | Tax Assessment Tax Assessment Total Assessment is a certain percentage of the fair market value that is determined by local assessors to be the total taxable value of land and additions on the property. | Land | Improvement |
|---|---|---|---|---|
| 2025 | $3,012 | $351,100 | $75,000 | $276,100 |
| 2024 | $3,012 | $331,600 | $75,000 | $256,600 |
| 2023 | $2,819 | $331,600 | $75,000 | $256,600 |
| 2022 | $2,564 | $301,700 | $65,000 | $236,700 |
| 2021 | $2,276 | $261,600 | $50,000 | $211,600 |
| 2020 | $2,276 | $261,600 | $50,000 | $211,600 |
| 2019 | $2,119 | $243,600 | $50,000 | $193,600 |
| 2018 | $2,073 | $238,300 | $50,000 | $188,300 |
| 2017 | $1,917 | $220,300 | $50,000 | $170,300 |
| 2016 | $1,839 | $211,400 | $50,000 | $161,400 |
| 2015 | $1,733 | $211,400 | $50,000 | $161,400 |
| 2014 | $1,733 | $199,200 | $50,000 | $149,200 |
Source: Public Records
Map
Nearby Homes
- 4141 English Holly Cir
- 4221 Hunter Green Ct
- 9202 Strum Ct
- 9317 Gildenfield Ct
- 9319 Coleson Rd
- 9402 Emmett Rd
- 4606 Grinding Stone Cir
- 4205 W End Dr
- 0 Chapman Mill Dr
- 1 Chapman Mill Dr
- 9304 Dolmen Rd
- 9524 Spring Moss Terrace Unit 9524
- 5004 Fairlake Ln
- 9015 Covewood Rd
- 10521 Boscastle Rd
- 4903 Covewood Ct
- 9401 Country Way Rd
- 5133 Ashborne Rd
- 9608 Timber Pass
- 10640 Cliffmore Dr
- 4217 Lanver Ln
- 4209 Lanver Ln
- 4145 English Holly Cir
- 4137 English Holly Cir
- 4221 Lanver Ln
- 4149 English Holly Cir
- 4212 Lanver Ln
- 4133 English Holly Cir
- 4205 Lanver Ln
- 4216 Lanver Ln
- 4153 English Holly Cir
- 4201 Lanver Ln
- 4208 Lanver Ln
- 4225 Lanver Ln
- 4200 Lanver Ln
- 4157 English Holly Cir
- 4140 English Holly Cir
- 4125 English Holly Cir
- 4204 Lanver Ln
- 4144 English Holly Cir