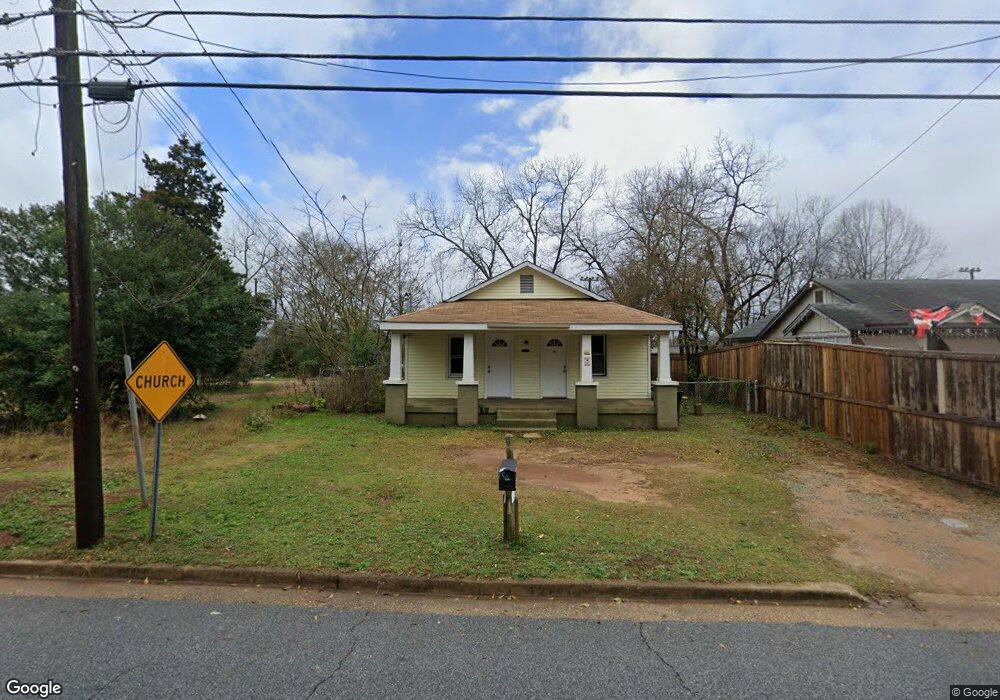
4213 Oates Ave Columbus, GA 31904
North Highlands NeighborhoodEstimated Value: $42,000 - $130,000
3
Beds
3
Baths
1,215
Sq Ft
$62/Sq Ft
Est. Value
About This Home
This home is located at 4213 Oates Ave, Columbus, GA 31904 and is currently estimated at $74,871, approximately $61 per square foot. 4213 Oates Ave is a home located in Muscogee County with nearby schools including Fox Elementary School, Arnold Middle School, and Jordan Vocational High School.
Ownership History
Date
Name
Owned For
Owner Type
Purchase Details
Closed on
Sep 11, 2014
Sold by
Home Investments Inc
Bought by
Dennard Gregory J
Current Estimated Value
Purchase Details
Closed on
Jul 29, 2014
Sold by
Nehemiah Community Reinves
Bought by
Ric Mark Properties Lllc
Purchase Details
Closed on
Apr 16, 2013
Sold by
Us Bank National Associati
Bought by
Nehemiah Community Reinvestmen
Purchase Details
Closed on
Oct 2, 2012
Sold by
Mcgarr Troy
Bought by
Us Bank National Association T
Create a Home Valuation Report for This Property
The Home Valuation Report is an in-depth analysis detailing your home's value as well as a comparison with similar homes in the area
Home Values in the Area
Average Home Value in this Area
Purchase History
| Date | Buyer | Sale Price | Title Company |
|---|---|---|---|
| Dennard Gregory J | $18,500 | -- | |
| Home Investments Inc | -- | -- | |
| Ric Mark Properties Lllc | $10,500 | -- | |
| Nehemiah Community Reinvestmen | -- | -- | |
| Us Bank National Association T | -- | -- |
Source: Public Records
Tax History
| Year | Tax Paid | Tax Assessment Tax Assessment Total Assessment is a certain percentage of the fair market value that is determined by local assessors to be the total taxable value of land and additions on the property. | Land | Improvement |
|---|---|---|---|---|
| 2025 | $571 | $14,580 | $4,820 | $9,760 |
| 2024 | $349 | $27,936 | $4,820 | $23,116 |
| 2023 | $351 | $19,168 | $4,820 | $14,348 |
| 2022 | $364 | $8,920 | $2,566 | $6,354 |
| 2021 | $364 | $8,920 | $2,566 | $6,354 |
| 2020 | $332 | $16,068 | $3,372 | $12,696 |
| 2019 | $333 | $8,120 | $2,436 | $5,684 |
| 2018 | $333 | $8,120 | $2,436 | $5,684 |
| 2017 | $334 | $8,120 | $2,436 | $5,684 |
| 2016 | $305 | $7,400 | $1,507 | $5,893 |
| 2015 | $122 | $7,400 | $1,507 | $5,893 |
| 2014 | $85 | $5,111 | $1,507 | $3,604 |
| 2013 | -- | $5,221 | $1,507 | $3,714 |
Source: Public Records
Map
Nearby Homes
Your Personal Tour Guide
Ask me questions while you tour the home.