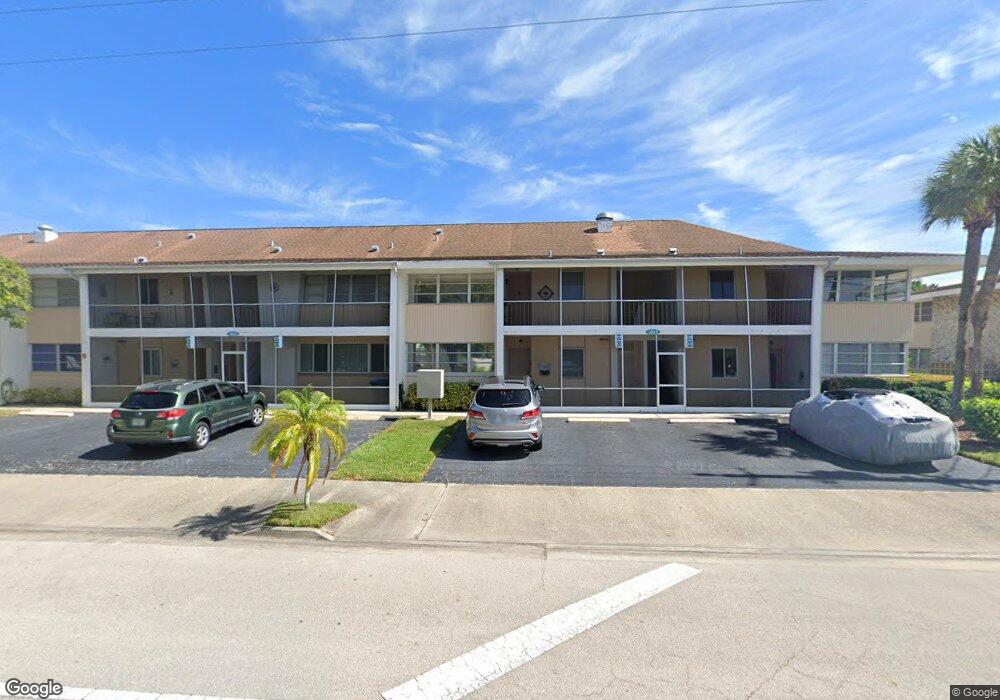
4213 Palm Tree Blvd Unit 5 Cape Coral, FL 33904
Bimini Basin NeighborhoodEstimated Value: $139,766 - $179,000
2
Beds
2
Baths
1,094
Sq Ft
$144/Sq Ft
Est. Value
About This Home
This home is located at 4213 Palm Tree Blvd Unit 5, Cape Coral, FL 33904 and is currently estimated at $157,942, approximately $144 per square foot. 4213 Palm Tree Blvd Unit 5 is a home located in Lee County with nearby schools including Cape Elementary School, Caloosa Elementary School, and Tropic Isles Elementary School.
Ownership History
Date
Name
Owned For
Owner Type
Purchase Details
Closed on
Aug 9, 2022
Sold by
Carlson Cheryl A
Bought by
Carlson Cheryl A
Current Estimated Value
Purchase Details
Closed on
Aug 25, 2015
Sold by
Fitzgerald Carol
Bought by
Carlson Cheryl A
Purchase Details
Closed on
Jan 6, 2011
Sold by
Fitzgerald Carol
Bought by
Fitzgerald Carol
Purchase Details
Closed on
Sep 30, 2008
Sold by
Federal National Mortgage Association
Bought by
Fitzgerald Carol
Purchase Details
Closed on
May 14, 2004
Sold by
Diblasio Joseph and Diblassio Joseph
Bought by
Ward Shirley Ruth
Home Financials for this Owner
Home Financials are based on the most recent Mortgage that was taken out on this home.
Original Mortgage
$128,250
Interest Rate
5.77%
Mortgage Type
Unknown
Purchase Details
Closed on
Feb 11, 2001
Sold by
Kiefer Helen M and Kiefer Donald E
Bought by
Diblasio Joseph
Create a Home Valuation Report for This Property
The Home Valuation Report is an in-depth analysis detailing your home's value as well as a comparison with similar homes in the area
Home Values in the Area
Average Home Value in this Area
Purchase History
| Date | Buyer | Sale Price | Title Company |
|---|---|---|---|
| Carlson Cheryl A | $100 | Neilson Law Pa | |
| Carlson Cheryl A | $83,000 | Palm Title Associates Inc | |
| Fitzgerald Carol | -- | Attorney | |
| Fitzgerald Carol | $64,500 | Watson Title Ins Agency Inc | |
| Ward Shirley Ruth | $142,500 | Title Professionals Of Flori | |
| Diblasio Joseph | $63,800 | -- |
Source: Public Records
Mortgage History
| Date | Status | Borrower | Loan Amount |
|---|---|---|---|
| Previous Owner | Ward Shirley Ruth | $128,250 |
Source: Public Records
Tax History Compared to Growth
Tax History
| Year | Tax Paid | Tax Assessment Tax Assessment Total Assessment is a certain percentage of the fair market value that is determined by local assessors to be the total taxable value of land and additions on the property. | Land | Improvement |
|---|---|---|---|---|
| 2025 | $948 | $73,547 | -- | -- |
| 2024 | $398 | $71,474 | -- | -- |
| 2023 | $398 | $2,197 | $0 | $2,197 |
| 2022 | $794 | $67,371 | $0 | $0 |
| 2021 | $785 | $83,599 | $0 | $83,599 |
| 2020 | $783 | $64,506 | $0 | $0 |
| 2019 | $768 | $63,056 | $0 | $0 |
| 2018 | $759 | $61,880 | $0 | $0 |
| 2017 | $750 | $60,607 | $0 | $0 |
| 2016 | $740 | $59,360 | $0 | $59,360 |
| 2015 | $416 | $53,300 | $0 | $53,300 |
| 2014 | -- | $50,900 | $0 | $50,900 |
| 2013 | -- | $39,100 | $0 | $39,100 |
Source: Public Records
Map
Nearby Homes
- 4213 Palm Tree Blvd Unit 9
- 4202 SE 4th Place Unit 10
- 403 SE 43rd Terrace Unit 6
- 4123 SE 3rd Ave
- 4118 SE 3rd Ave
- 4224 SE 2nd Ave
- 235 SE 44th St
- 4026 SE 3rd Ave
- 246 SE 44th St
- 203 SE 43rd Terrace
- 4321 Country Club Blvd Unit 101
- 4129 SE 1st Place
- 4218 SE 6th Place
- 4005 Palm Tree Blvd Unit 103
- 4216 SE 7th Ave
- 235 SE 45th St
- 4411 Country Club Blvd Unit A2
- 4411 Country Club Blvd Unit A1
- 4417 Country Club Blvd Unit B6
- 3926 Palm Tree Blvd
- 4213 Palm Tree Blvd
- 4213 Palm Tree Blvd Unit 8
- 4213 Palm Tree Blvd Unit 2
- 4213 Palm Tree Blvd Unit 6
- 4213 Palm Tree Blvd Unit 10
- 4213 Palm Tree Blvd Unit 7
- 4213 Palm Tree Blvd Unit 4
- 4213 Palm Tree Blvd Unit 3
- 402 SE 42nd Terrace Unit D7
- 402 SE 42nd Terrace Unit 1
- 402 SE 42nd Terrace Unit 10
- 402 SE 42nd Terrace Unit 6
- 402 SE 42nd Terrace Unit 5
- 402 SE 42nd Terrace Unit 9
- 402 SE 42nd Terrace Unit 4
- 402 SE 42nd Terrace Unit 12
- 402 SE 42nd Terrace Unit 11
- 402 SE 42nd Terrace Unit 7
- 402 SE 42nd Terrace Unit 3
- 402 SE 42nd Terrace Unit 2