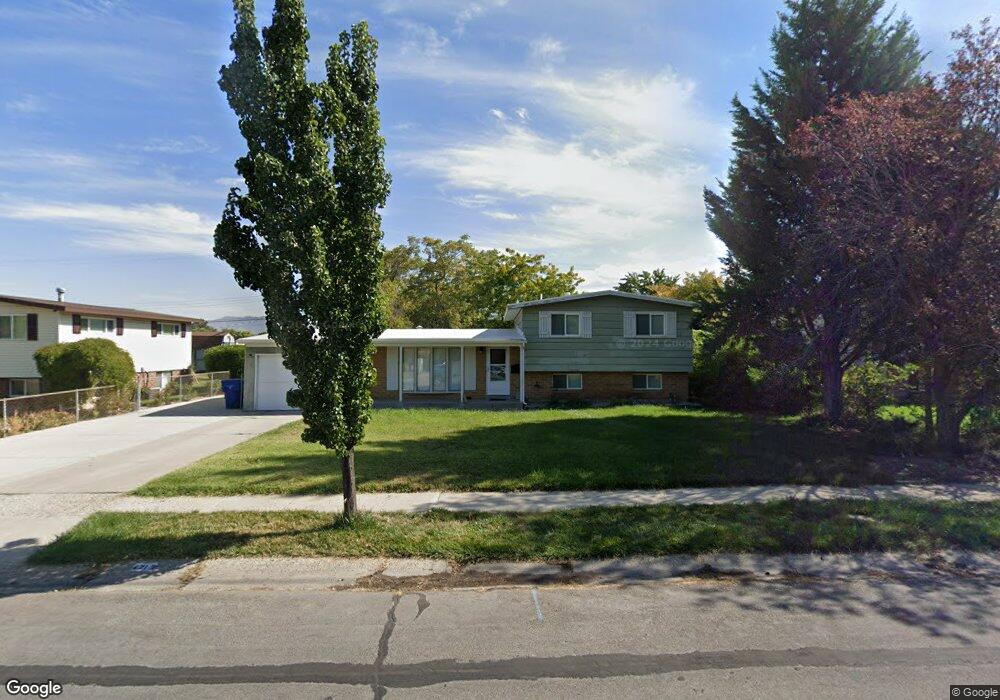
4213 S Barker Rd Taylorsville, UT 84129
Estimated Value: $392,000 - $475,057
3
Beds
3
Baths
1,786
Sq Ft
$251/Sq Ft
Est. Value
About This Home
This home is located at 4213 S Barker Rd, Taylorsville, UT 84129 and is currently estimated at $447,764, approximately $250 per square foot. 4213 S Barker Rd is a home located in Salt Lake County with nearby schools including Taylorsville Elementary School, Eisenhower Jr High School, and Taylorsville High School.
Ownership History
Date
Name
Owned For
Owner Type
Purchase Details
Closed on
May 30, 2025
Sold by
Bonnie Barker Trust and Barker Bonnie
Bought by
Tuia Mailei and Gonzalez Emma
Current Estimated Value
Home Financials for this Owner
Home Financials are based on the most recent Mortgage that was taken out on this home.
Original Mortgage
$458,541
Outstanding Balance
$456,921
Interest Rate
5.13%
Mortgage Type
FHA
Estimated Equity
-$9,157
Purchase Details
Closed on
Jun 1, 2020
Sold by
Barker Bonnie
Bought by
Barker Bonnie and Bonnie Barker Trust
Home Financials for this Owner
Home Financials are based on the most recent Mortgage that was taken out on this home.
Original Mortgage
$209,950
Interest Rate
3.3%
Mortgage Type
New Conventional
Purchase Details
Closed on
Jan 30, 2020
Sold by
Barker Bonnie
Bought by
Barker Bonnie and The Bonnie Barker Trust
Purchase Details
Closed on
May 25, 2018
Sold by
Hoopes Brain and Hoopes Emily C
Bought by
Barker Bonnie
Home Financials for this Owner
Home Financials are based on the most recent Mortgage that was taken out on this home.
Original Mortgage
$213,600
Interest Rate
4.4%
Mortgage Type
New Conventional
Purchase Details
Closed on
Sep 2, 2016
Sold by
Hoopers Brian D and Hoopers Emily C
Bought by
Hoopers Vrian and Hoopers Emily C
Home Financials for this Owner
Home Financials are based on the most recent Mortgage that was taken out on this home.
Original Mortgage
$130,500
Interest Rate
2.78%
Mortgage Type
New Conventional
Purchase Details
Closed on
Nov 29, 2005
Sold by
Taylor Dustin David and Taylor Amanda Lee
Bought by
Hoopes Brian D and Hoopes Emily C
Home Financials for this Owner
Home Financials are based on the most recent Mortgage that was taken out on this home.
Original Mortgage
$30,600
Interest Rate
6.07%
Mortgage Type
Stand Alone Second
Purchase Details
Closed on
Oct 13, 2000
Sold by
Pfeiffer Floyd M and Pfeiffer Debra M
Bought by
Taylor Dustin David and Schaugaard Amanda Lee
Home Financials for this Owner
Home Financials are based on the most recent Mortgage that was taken out on this home.
Original Mortgage
$122,986
Interest Rate
7.96%
Mortgage Type
FHA
Purchase Details
Closed on
Aug 25, 1999
Sold by
Neseth Thomas E and Tungland Mavis D
Bought by
Pfeiffer Floyd M and Pfeiffer Debra M
Home Financials for this Owner
Home Financials are based on the most recent Mortgage that was taken out on this home.
Original Mortgage
$116,350
Interest Rate
7.56%
Mortgage Type
VA
Create a Home Valuation Report for This Property
The Home Valuation Report is an in-depth analysis detailing your home's value as well as a comparison with similar homes in the area
Home Values in the Area
Average Home Value in this Area
Purchase History
| Date | Buyer | Sale Price | Title Company |
|---|---|---|---|
| Tuia Mailei | -- | Fidelity National Title | |
| Barker Bonnie | -- | Cottonwood Title | |
| Barker Bonnie | -- | Chicago Title | |
| Barker Bonnie | -- | None Available | |
| Barker Bonnie | -- | Inwest Title Srvs Slc | |
| Hoopers Vrian | -- | Meridian Title | |
| Hoopes Brian D | -- | Equity Title | |
| Taylor Dustin David | -- | Backman Stewart Title Servic | |
| Pfeiffer Floyd M | -- | Backman Stewart Title Servic |
Source: Public Records
Mortgage History
| Date | Status | Borrower | Loan Amount |
|---|---|---|---|
| Open | Tuia Mailei | $458,541 | |
| Previous Owner | Barker Bonnie | $209,950 | |
| Previous Owner | Barker Bonnie | $213,600 | |
| Previous Owner | Hoopers Vrian | $130,500 | |
| Previous Owner | Hoopes Brian D | $30,600 | |
| Previous Owner | Hoopes Brian D | $122,400 | |
| Previous Owner | Taylor Dustin David | $122,986 | |
| Previous Owner | Pfeiffer Floyd M | $116,350 |
Source: Public Records
Tax History Compared to Growth
Tax History
| Year | Tax Paid | Tax Assessment Tax Assessment Total Assessment is a certain percentage of the fair market value that is determined by local assessors to be the total taxable value of land and additions on the property. | Land | Improvement |
|---|---|---|---|---|
| 2025 | $2,646 | $452,800 | $102,700 | $350,100 |
| 2024 | $2,646 | $433,900 | $98,300 | $335,600 |
| 2023 | $2,646 | $411,000 | $94,500 | $316,500 |
| 2022 | $2,487 | $403,600 | $92,700 | $310,900 |
| 2021 | $2,313 | $326,900 | $71,300 | $255,600 |
| 2020 | $2,135 | $285,600 | $63,400 | $222,200 |
| 2019 | $2,092 | $273,200 | $63,400 | $209,800 |
| 2018 | $0 | $223,600 | $63,400 | $160,200 |
| 2017 | $1,525 | $201,800 | $60,300 | $141,500 |
| 2016 | $1,378 | $182,200 | $60,300 | $121,900 |
| 2015 | $1,347 | $166,500 | $76,000 | $90,500 |
| 2014 | $1,292 | $156,800 | $72,100 | $84,700 |
Source: Public Records
Map
Nearby Homes
- 1998 Theckston Rd
- 2221 W Davenshire Ln
- 2121 W 4100 S
- 2258 W 4185 S
- 2267 W 4240 S
- 4203 Morris St
- 2318 W 4220 S
- 4257 S Morris St
- 1762 Mantle Ave
- 1854 W 4100 S
- 1901 Kirkham Way
- 2409 W Hardrock Dr
- 2451 Hard Rock Cir S
- 4255 S Redwood Rd W
- 4188 S Oak Meadows Dr Unit 21
- 4111 S Greyhackle Ln
- 4107 S Greyhackle Ln
- 4077 Tralee Cir
- 4176 S Oak Meadows Dr Unit 10
- 4148 S Oak Meadows Dr Unit 31
- 4203 Barker Rd
- 4221 Barker Rd
- 4193 Barker Rd
- 4210 Barker Rd
- 2108 Mantle Ave
- 4200 Barker Rd
- 4200 S Barker Rd
- 2071 Mantle Ave
- 4185 Barker Rd
- 4190 Barker Rd
- 2083 Mantle Ave
- 2083 W Mantle Ave
- 2057 Mantle Ave
- 2101 W Mantle Ave
- 2101 Mantle Ave
- 4211 Mackay Dr
- 4211 S Mackay Dr
- 2130 Mantle Ave
- 2041 Mantle Ave
- 4201 Mackay Dr