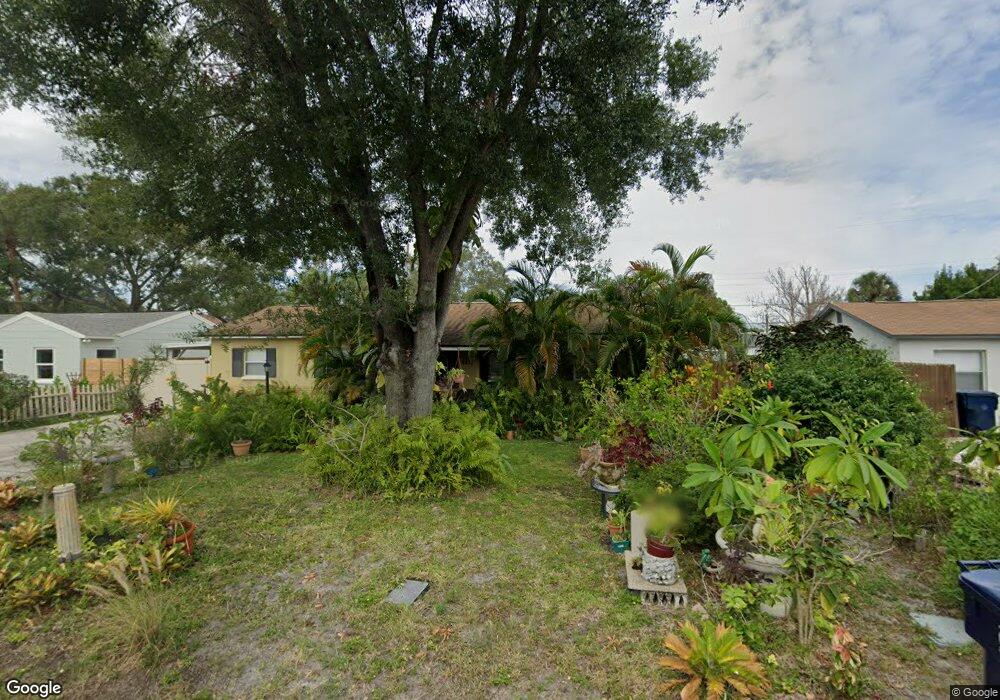
4213 W Bay View Ave Tampa, FL 33611
Fair Oaks NeighborhoodEstimated Value: $452,070 - $585,000
3
Beds
2
Baths
1,804
Sq Ft
$295/Sq Ft
Est. Value
About This Home
This home is located at 4213 W Bay View Ave, Tampa, FL 33611 and is currently estimated at $532,018, approximately $294 per square foot. 4213 W Bay View Ave is a home located in Hillsborough County with nearby schools including Anderson Elementary School, Foothills Elementary School, and Madison Middle School.
Ownership History
Date
Name
Owned For
Owner Type
Purchase Details
Closed on
Dec 1, 2010
Sold by
Investors Land Trust Services Llc
Bought by
Wolf Indranee
Current Estimated Value
Purchase Details
Closed on
Oct 14, 2010
Sold by
Pennymac Loan Services Llc
Bought by
Investors Land Trust Services Llc
Purchase Details
Closed on
Apr 30, 2010
Sold by
Bliven Samuel and Bliven Dale B
Bought by
Pennymac Loan Services Llc
Purchase Details
Closed on
Jun 29, 2007
Sold by
Osmer Dale and Bilven Dale
Bought by
Bilven Samuel and Osmer Dale
Home Financials for this Owner
Home Financials are based on the most recent Mortgage that was taken out on this home.
Original Mortgage
$196,000
Interest Rate
9.74%
Mortgage Type
New Conventional
Purchase Details
Closed on
Oct 28, 1993
Sold by
Bk Tampa
Bought by
Osmer Dale
Home Financials for this Owner
Home Financials are based on the most recent Mortgage that was taken out on this home.
Original Mortgage
$51,200
Interest Rate
7.07%
Create a Home Valuation Report for This Property
The Home Valuation Report is an in-depth analysis detailing your home's value as well as a comparison with similar homes in the area
Home Values in the Area
Average Home Value in this Area
Purchase History
| Date | Buyer | Sale Price | Title Company |
|---|---|---|---|
| Wolf Indranee | $200,000 | Attorney | |
| Investors Land Trust Services Llc | $120,561 | Attorney | |
| Pennymac Loan Services Llc | $196,000 | Attorney | |
| Bilven Samuel | -- | The Title Depot Inc | |
| Osmer Dale | $64,000 | -- |
Source: Public Records
Mortgage History
| Date | Status | Borrower | Loan Amount |
|---|---|---|---|
| Previous Owner | Bilven Samuel | $196,000 | |
| Previous Owner | Osmer Dale | $51,200 |
Source: Public Records
Tax History Compared to Growth
Tax History
| Year | Tax Paid | Tax Assessment Tax Assessment Total Assessment is a certain percentage of the fair market value that is determined by local assessors to be the total taxable value of land and additions on the property. | Land | Improvement |
|---|---|---|---|---|
| 2024 | $2,180 | $147,425 | -- | -- |
| 2023 | $2,112 | $143,131 | $0 | $0 |
| 2022 | $2,130 | $138,962 | $0 | $0 |
| 2021 | $2,095 | $134,915 | $0 | $0 |
| 2020 | $2,061 | $133,052 | $0 | $0 |
| 2019 | $2,001 | $130,061 | $0 | $0 |
| 2018 | $1,967 | $127,636 | $0 | $0 |
| 2017 | $1,920 | $169,334 | $0 | $0 |
| 2016 | $1,853 | $122,440 | $0 | $0 |
| 2015 | $1,795 | $121,589 | $0 | $0 |
| 2014 | $1,711 | $120,624 | $0 | $0 |
| 2013 | -- | $118,841 | $0 | $0 |
Source: Public Records
Map
Nearby Homes
- 4219 W Bay View Ave
- 4228 W Bay Vista Ave
- 4202 W Bay Vista Ave
- 4106 W Bay View Ave
- 4103 W Knights Ave
- 4312 S Hubert Ave
- 4104 W Norma Ave
- 4310 S Coolidge Ave
- 4109 W Bay Court Ave
- 4216 W Euclid Ave
- 4108 W Euclid Ave
- 4312 S Clark Ave
- 3622 S Coolidge Ave
- 4317 S Hale Ave
- 4410 W Bay Court Ave
- 4405 W Anita Blvd
- 4406 W Euclid Ave
- 4112 W Lawn Ave
- 4324 S Clark Ave
- 4335 S Coolidge Ave
- 4215 W Bay View Ave
- 4211 W Bay View Ave
- 4214 W Bay Vista Ave
- 4216 W Bay Vista Ave
- 4212 W Bay Vista Ave
- 4217 W Bay View Ave
- 4214 W Bay View Ave
- 4218 W Bay Vista Ave
- 4216 W Bay View Ave
- 4212 W Bay View Ave
- 4218 W Bay View Ave
- 4207 W Bay View Ave
- 4220 W Bay Vista Ave
- 4220 W Bay View Ave
- 4213 W Bay Vista Ave
- 4208 W Bay View Ave
- 4215 W Bay Vista Ave
- 4211 W Bay Vista Ave
- 4221 W Bay View Ave
- 4205 W Bay View Ave