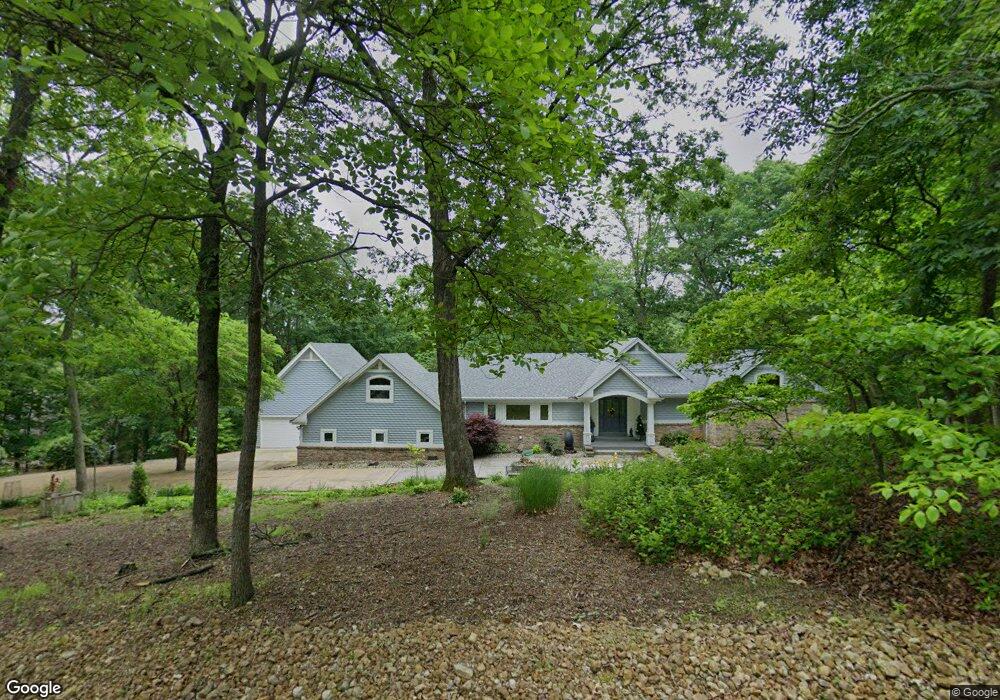
4214 N Fork Rd Wildwood, MO 63025
Estimated Value: $520,000 - $725,000
3
Beds
3
Baths
3,400
Sq Ft
$181/Sq Ft
Est. Value
About This Home
This home is located at 4214 N Fork Rd, Wildwood, MO 63025 and is currently estimated at $614,395, approximately $180 per square foot. 4214 N Fork Rd is a home located in St. Louis County with nearby schools including Blevins Elementary School, Lasalle Springs Middle School, and Eureka Senior High School.
Ownership History
Date
Name
Owned For
Owner Type
Purchase Details
Closed on
Oct 29, 2010
Sold by
Wexler Randy J and Wexler Kelly A
Bought by
Koester Richard W and Koester Geralynn
Current Estimated Value
Home Financials for this Owner
Home Financials are based on the most recent Mortgage that was taken out on this home.
Original Mortgage
$350,000
Outstanding Balance
$231,080
Interest Rate
4.36%
Mortgage Type
New Conventional
Estimated Equity
$383,315
Purchase Details
Closed on
Mar 7, 2006
Sold by
Phillips Roger J and Ridings Rosanna I
Bought by
Wexler Randy J and Wexler Kelly A
Home Financials for this Owner
Home Financials are based on the most recent Mortgage that was taken out on this home.
Original Mortgage
$373,012
Interest Rate
6.09%
Mortgage Type
VA
Purchase Details
Closed on
Jan 10, 2003
Sold by
Phillips Roger and Ridings Rosanna
Bought by
Phillips Roger J and Ridings Rosanna I
Purchase Details
Closed on
Mar 10, 1998
Sold by
Phillips Roger J and Ridings Rosanna I
Bought by
Phillips Roger J and Ridings Rosanna I
Create a Home Valuation Report for This Property
The Home Valuation Report is an in-depth analysis detailing your home's value as well as a comparison with similar homes in the area
Home Values in the Area
Average Home Value in this Area
Purchase History
| Date | Buyer | Sale Price | Title Company |
|---|---|---|---|
| Koester Richard W | $437,500 | Assured Title Company West | |
| Wexler Randy J | $387,500 | None Available | |
| Phillips Roger J | -- | -- | |
| Phillips Roger J | -- | -- |
Source: Public Records
Mortgage History
| Date | Status | Borrower | Loan Amount |
|---|---|---|---|
| Open | Koester Richard W | $350,000 | |
| Previous Owner | Wexler Randy J | $373,012 |
Source: Public Records
Tax History Compared to Growth
Tax History
| Year | Tax Paid | Tax Assessment Tax Assessment Total Assessment is a certain percentage of the fair market value that is determined by local assessors to be the total taxable value of land and additions on the property. | Land | Improvement |
|---|---|---|---|---|
| 2025 | $6,506 | $105,450 | $29,830 | $75,620 |
| 2024 | $6,506 | $90,290 | $24,420 | $65,870 |
| 2023 | $6,509 | $90,290 | $24,420 | $65,870 |
| 2022 | $6,175 | $79,850 | $27,110 | $52,740 |
| 2021 | $6,125 | $87,300 | $27,110 | $60,190 |
| 2020 | $5,949 | $74,330 | $23,070 | $51,260 |
| 2019 | $5,969 | $74,330 | $23,070 | $51,260 |
| 2018 | $6,297 | $74,100 | $23,070 | $51,030 |
| 2017 | $6,055 | $74,100 | $23,070 | $51,030 |
| 2016 | $5,287 | $62,230 | $17,500 | $44,730 |
| 2015 | $5,242 | $62,230 | $17,500 | $44,730 |
| 2014 | -- | $54,580 | $8,850 | $45,730 |
Source: Public Records
Map
Nearby Homes
- 32 Rockwood Forest Valley
- 28 Thornhill Dr
- 4606 Hickory Ridge View Ct
- 4506 Thunder Ridge Rd
- 17472 Thunder Valley Dr
- 17047 Redwood Glen Dr
- 744 Forby Rd
- 17234 Hilltop Ridge Dr
- 211 Walden Ct
- 17480 Wyman Ridge Dr
- 568 Hilltop Townes Dr
- 964 Shire Ln
- 2166 Old State Rd
- 117 Edward Dr
- 126 Shaw Dr
- 17603 Hitching Post Ct
- 7 W North St
- 161 Dartingbird Ln Unit D
- 1512 Saint James Place Ct
- 634 N Virginia Ave
- 4205 N Fork Rd
- 17251 Lost Cabin Rd
- 17246 Lost Cabin Rd
- 17221 Lost Cabin Rd
- 4148 Alt Rd
- 17222 Lost Cabin Rd
- 17234 Lost Cabin Rd
- 40 Rockwood Forest Ridge
- 4140 Alt Rd
- 39 Rockwood Forest Ridge
- 17258 Lost Cabin Rd
- 41 Rockwood Forest Ridge
- 17305 Hidden Valley Dr
- 4132 Alt Rd
- 38 Rockwood Forest Ridge
- 21 Rockwood Forest Valley
- 43 Rockwood Forest Hill
- 17329 Hidden Valley Dr
- 44 Rockwood Forest Hill
- 4124 Alt Rd