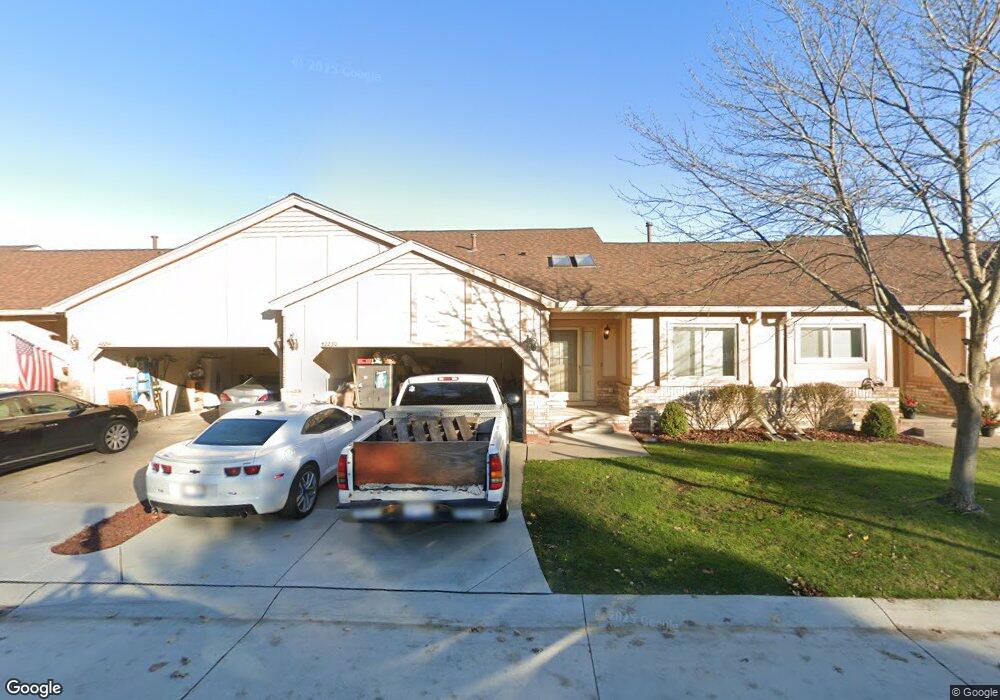
42145 Hidden Brook Dr Unit 12-58 Clinton Township, MI 48038
Estimated Value: $237,000 - $259,000
2
Beds
2
Baths
1,215
Sq Ft
$204/Sq Ft
Est. Value
About This Home
This home is located at 42145 Hidden Brook Dr Unit 12-58, Clinton Township, MI 48038 and is currently estimated at $247,941, approximately $204 per square foot. 42145 Hidden Brook Dr Unit 12-58 is a home located in Macomb County with nearby schools including Erie Elementary School, Wyandot Middle School, and Chippewa Valley High School.
Ownership History
Date
Name
Owned For
Owner Type
Purchase Details
Closed on
Jul 28, 2017
Sold by
Talbot Deborah
Bought by
Naylor Erma
Current Estimated Value
Purchase Details
Closed on
Sep 1, 2015
Sold by
Talbot Deborah M and Kushner John Arthur
Bought by
Kushner Mary Ellen and Mary Ellen Kushner Revocable Living Trus
Purchase Details
Closed on
Jan 2, 2013
Sold by
Kushner John A and Kushner Mary Ellen
Bought by
Kushner John Arthur and Ralbot Deborah M
Purchase Details
Closed on
Dec 20, 2012
Sold by
Kushner John A and Kushner Mary Ellen
Bought by
Kushner John Arthur and Ralbot Deborah M
Purchase Details
Closed on
Jun 22, 2012
Sold by
Dyer Catherine A
Bought by
Kushner John A and Kushner Mary Ellen
Purchase Details
Closed on
Aug 1, 2007
Sold by
Dyer Catherine A
Bought by
Dyer Catherine A and Catherine A Dyer Trust
Purchase Details
Closed on
Oct 2, 1995
Sold by
Dubay K
Bought by
Dyer C
Create a Home Valuation Report for This Property
The Home Valuation Report is an in-depth analysis detailing your home's value as well as a comparison with similar homes in the area
Home Values in the Area
Average Home Value in this Area
Purchase History
| Date | Buyer | Sale Price | Title Company |
|---|---|---|---|
| Naylor Erma | $146,500 | Sterling Title Agency | |
| Kushner Mary Ellen | -- | Attorney | |
| Kushner John Arthur | -- | None Available | |
| Kushner John Arthur | -- | None Available | |
| Kushner John A | $80,000 | None Available | |
| Dyer Catherine A | -- | None Available | |
| Dyer C | $105,000 | -- |
Source: Public Records
Tax History Compared to Growth
Tax History
| Year | Tax Paid | Tax Assessment Tax Assessment Total Assessment is a certain percentage of the fair market value that is determined by local assessors to be the total taxable value of land and additions on the property. | Land | Improvement |
|---|---|---|---|---|
| 2025 | $3,442 | $110,700 | $0 | $0 |
| 2024 | $2,051 | $104,300 | $0 | $0 |
| 2023 | $1,945 | $90,800 | $0 | $0 |
| 2022 | $3,119 | $81,400 | $0 | $0 |
| 2021 | $3,033 | $79,800 | $0 | $0 |
| 2020 | $1,785 | $77,700 | $0 | $0 |
| 2019 | $2,825 | $73,500 | $0 | $0 |
| 2018 | $2,248 | $63,800 | $0 | $0 |
| 2017 | $2,494 | $55,000 | $12,500 | $42,500 |
| 2016 | $2,477 | $55,000 | $0 | $0 |
| 2015 | -- | $47,900 | $0 | $0 |
| 2014 | -- | $41,000 | $0 | $0 |
| 2011 | -- | $42,000 | $0 | $42,000 |
Source: Public Records
Map
Nearby Homes
- 42201 Hidden Brook Dr Unit 68
- 42266 Brookview Ln Unit 1
- 42407 Creekside Dr Unit 165
- 41985 Dorchester Ct
- 42150 Margaret Dr
- 18144 N Oak Dr
- 41825 Alden Dr
- 18960 Sandhurst Dr
- 41416 Justin Dr
- 42246 Toddmark Ln
- 42184 Toddmark Ln Unit 21
- 41664 Stonehenge Manor Dr
- 17917 Pointe Ct
- 42222 Toddmark Ln Unit 53
- 41201 Whispering Oaks Dr Unit 17
- 19054 Marisa Dr
- 41146 Justin Dr
- 41992 Merrimac Cir
- 41321 Chestnut Dr
- 42201 Toddmark Ln
- 42145 Hidden Brook Dr
- 42141 Hidden Brook Dr
- 42137 Hidden Brook Dr
- 42133 Hidden Brook Dr
- 42137 Hidden Brook Dr Unit 56
- 42145 Hidden Brook Dr Unit 58
- 42101 Hidden Brook Dr
- 42105 Hidden Brook Dr
- 42109 Hidden Brook Dr Unit 52
- 42113 Hidden Brook Dr Unit 51
- 42117 Hidden Brook Dr
- 42121 Hidden Brook Dr
- 42113 Hidden Brook Dr Unit 11-51
- 42109 Hidden Brook Dr Unit 11-52
- 42117 Hidden Brook Dr Unit 50 / Bldg 11
- 42134 Hidden Brook Dr
- 42138 Hidden Brook Dr
- 42142 Hidden Brook Dr
- 42146 Hidden Brook Dr
- 42142 Hidden Brook Dr Unit 10-46