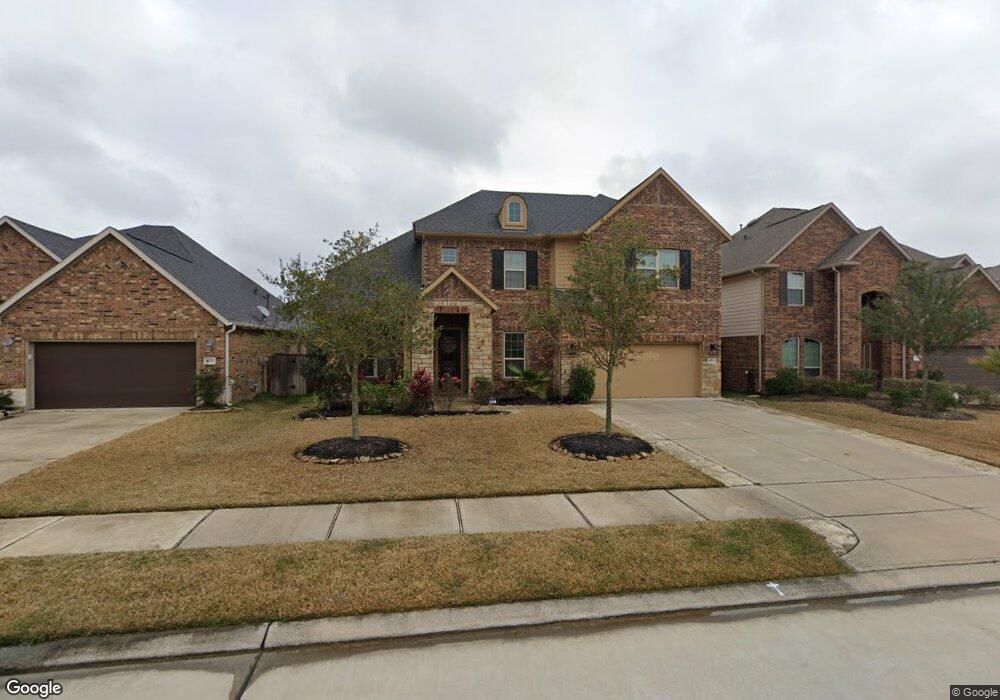
4215 Brannon Branch Ct Fulshear, TX 77441
Estimated Value: $568,096 - $629,000
4
Beds
4
Baths
3,806
Sq Ft
$156/Sq Ft
Est. Value
About This Home
This home is located at 4215 Brannon Branch Ct, Fulshear, TX 77441 and is currently estimated at $594,274, approximately $156 per square foot. 4215 Brannon Branch Ct is a home located in Fort Bend County with nearby schools including Campbell Elementary School, Joe M. Adams Junior High, and Sugar Creek Montessori - Fulshear/West Katy.
Ownership History
Date
Name
Owned For
Owner Type
Purchase Details
Closed on
Jun 28, 2016
Sold by
Arciniega Richard J and Arciniega Kelley L
Bought by
Petrovich Yuri
Current Estimated Value
Home Financials for this Owner
Home Financials are based on the most recent Mortgage that was taken out on this home.
Original Mortgage
$267,600
Outstanding Balance
$214,175
Interest Rate
3.66%
Mortgage Type
New Conventional
Estimated Equity
$380,099
Purchase Details
Closed on
Dec 22, 2014
Sold by
Arciniega Richard J and Arciniega Kelley L
Bought by
Arciniega Joe F and Arciniega Gloria
Home Financials for this Owner
Home Financials are based on the most recent Mortgage that was taken out on this home.
Original Mortgage
$120,000
Interest Rate
4.05%
Purchase Details
Closed on
Sep 11, 2014
Sold by
Beazer Homes Texas Lp
Bought by
Arciniega Richard J and Arciniega Kelley L
Home Financials for this Owner
Home Financials are based on the most recent Mortgage that was taken out on this home.
Original Mortgage
$120,000
Interest Rate
4.18%
Mortgage Type
New Conventional
Create a Home Valuation Report for This Property
The Home Valuation Report is an in-depth analysis detailing your home's value as well as a comparison with similar homes in the area
Home Values in the Area
Average Home Value in this Area
Purchase History
| Date | Buyer | Sale Price | Title Company |
|---|---|---|---|
| Petrovich Yuri | -- | Startex Title | |
| Arciniega Joe F | -- | None Available | |
| Arciniega Richard J | -- | None Available |
Source: Public Records
Mortgage History
| Date | Status | Borrower | Loan Amount |
|---|---|---|---|
| Open | Petrovich Yuri | $267,600 | |
| Previous Owner | Arciniega Joe F | $120,000 | |
| Previous Owner | Arciniega Richard J | $120,000 |
Source: Public Records
Tax History Compared to Growth
Tax History
| Year | Tax Paid | Tax Assessment Tax Assessment Total Assessment is a certain percentage of the fair market value that is determined by local assessors to be the total taxable value of land and additions on the property. | Land | Improvement |
|---|---|---|---|---|
| 2025 | $10,174 | $524,423 | $82,583 | $441,840 |
| 2024 | $10,174 | $481,822 | $11,553 | $470,269 |
| 2023 | $9,420 | $438,020 | $0 | $449,061 |
| 2022 | $10,200 | $398,200 | $0 | $424,020 |
| 2021 | $10,406 | $362,000 | $63,530 | $298,470 |
| 2020 | $10,509 | $358,420 | $55,000 | $303,420 |
| 2019 | $11,208 | $358,020 | $55,000 | $303,020 |
| 2018 | $10,508 | $335,110 | $55,000 | $280,110 |
| 2017 | $10,505 | $334,500 | $55,000 | $279,500 |
| 2016 | $6,052 | $192,690 | $27,500 | $165,190 |
| 2015 | $3,581 | $188,040 | $27,500 | $160,540 |
| 2014 | $760 | $36,000 | $36,000 | $0 |
Source: Public Records
Map
Nearby Homes
- 4218 Brannon Branch Ct
- 4110 Addison Ranch Ln
- 28131 Twin Knolls Ln
- 27514 Wilson Run Ln
- 27603 Huggins Crest Ct
- 4915 Medina Bend Ln
- 3710 Meadowmist Ct
- 27410 Ashland Meadow Ln
- 28807 Mayes Bluff Dr
- 27415 Royal Canyon Ln
- 4943 Ginger Bluff Trail
- 27330 Aspen Falls Ln
- 27414 Wooded Canyon Dr
- 27842 Harper Meadow Ln
- 4930 Scenic Horizon Ln
- 27419 Canyon Reach Dr
- 27318 Symphony Creek Ln
- 27411 Canyon Reach Dr
- 27423 Sunrise Ranch Ln
- 4314 Kent Ranch Ct
- 4219 Brannon Branch Ct
- 4211 Brannon Branch Ct
- 4207 Brannon Branch Ct
- 4223 Brannon Branch Ct
- 4214 Lodge Ranch Ct
- 4222 Lodge Ranch
- 4218 Lodge Ranch Ct
- 4206 Lodge Ranch Ct
- 4203 Brannon Branch Ct
- 4210 Lodge Ranch Ct
- 4214 Brannon Branch Ct
- 4210 Brannon Branch Ct
- 4227 Brannon Branch Ct
- 4226 Brannon Branch Ct
- 4206 Brannon Branch Ct
- 4222 Brannon Branch Ct
- 4123 Brannon Branch Ct
- 4215 Lodge Ranch Ct
- 4226 Lodge Ranch Ct
- 4219 Lodge Ranch Ct