4215 N 500 E Hamlet, IN 46532
Estimated Value: $163,000
4
Beds
1
Bath
1,464
Sq Ft
$111/Sq Ft
Est. Value
About This Home
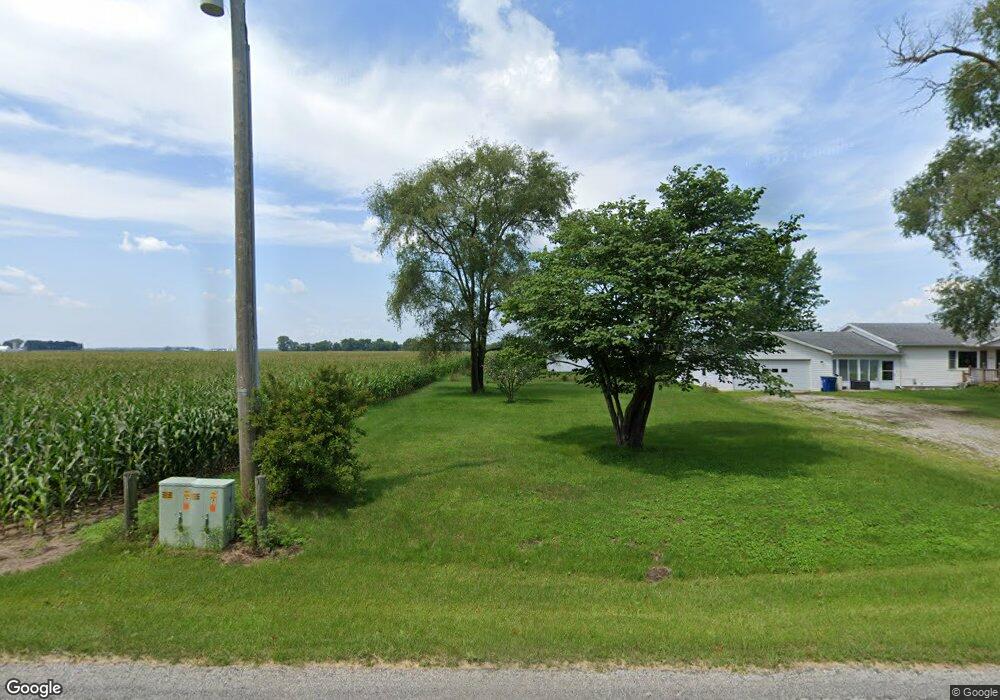
This home is located at 4215 N 500 E, Hamlet, IN 46532 and is currently estimated at $163,000, approximately $111 per square foot. 4215 N 500 E is a home located in Starke County with nearby schools including Oregon-Davis Elementary School and Oregon-Davis Junior/Senior High School.
Ownership History
Date
Name
Owned For
Owner Type
Purchase Details
Closed on
May 10, 2019
Sold by
Marsh Douglas J
Bought by
Chasing A Buck Farms Llc
Current Estimated Value
Home Financials for this Owner
Home Financials are based on the most recent Mortgage that was taken out on this home.
Original Mortgage
$121,754
Outstanding Balance
$105,472
Interest Rate
4%
Mortgage Type
FHA
Estimated Equity
$57,528
Purchase Details
Closed on
Mar 9, 2018
Sold by
Marsh Elaine M
Bought by
Marsh Elaine M and Marsh Douglas J
Create a Home Valuation Report for This Property
The Home Valuation Report is an in-depth analysis detailing your home's value as well as a comparison with similar homes in the area
Purchase History
| Date | Buyer | Sale Price | Title Company |
|---|---|---|---|
| Chasing A Buck Farms Llc | -- | Meridian Title Company | |
| Goliver Ashley L | -- | Meridian Title Corp | |
| Marsh Elaine M | -- | None Available |
Source: Public Records
Mortgage History
| Date | Status | Borrower | Loan Amount |
|---|---|---|---|
| Open | Goliver Ashley L | $121,754 |
Source: Public Records
Tax History
| Year | Tax Paid | Tax Assessment Tax Assessment Total Assessment is a certain percentage of the fair market value that is determined by local assessors to be the total taxable value of land and additions on the property. | Land | Improvement |
|---|---|---|---|---|
| 2025 | $1,781 | $90,200 | $90,200 | $0 |
| 2024 | $1,781 | $97,000 | $97,000 | $0 |
| 2023 | $1,649 | $80,900 | $80,900 | $0 |
| 2022 | $1,186 | $63,800 | $63,800 | $0 |
| 2021 | $1,133 | $55,000 | $55,000 | $0 |
| 2020 | $1,344 | $54,500 | $54,500 | $0 |
| 2019 | $2,660 | $163,400 | $108,600 | $54,800 |
| 2018 | $2,649 | $163,700 | $110,800 | $52,900 |
| 2017 | $2,696 | $172,700 | $124,500 | $48,200 |
| 2016 | $2,743 | $177,700 | $131,000 | $46,700 |
| 2014 | $2,553 | $183,200 | $136,300 | $46,900 |
| 2013 | $1,891 | $165,600 | $119,100 | $46,500 |
Source: Public Records
Map
Nearby Homes
- 202 S Jefferson St
- 68 S Jefferson St
- 66 S Jefferson St
- 109 S Jefferson St
- 4500 E 300 N
- 101 S Hamlet St
- 205 W Pearl St
- 10 S Mccormick St
- 301 N Starke St
- 0 Cr 600 N
- 4420 N 700 E
- 4170 E 250 N
- 1615 N 300 E
- 100 N Portland St
- 10300 E 150 N
- V/L E 100 N
- 735 N 600 E
- 551 E Mound St
- 810 E Washington St
- 303 E Lake St
Your Personal Tour Guide
Ask me questions while you tour the home.