Estimated Value: $111,836 - $168,000
2
Beds
1
Bath
864
Sq Ft
$169/Sq Ft
Est. Value
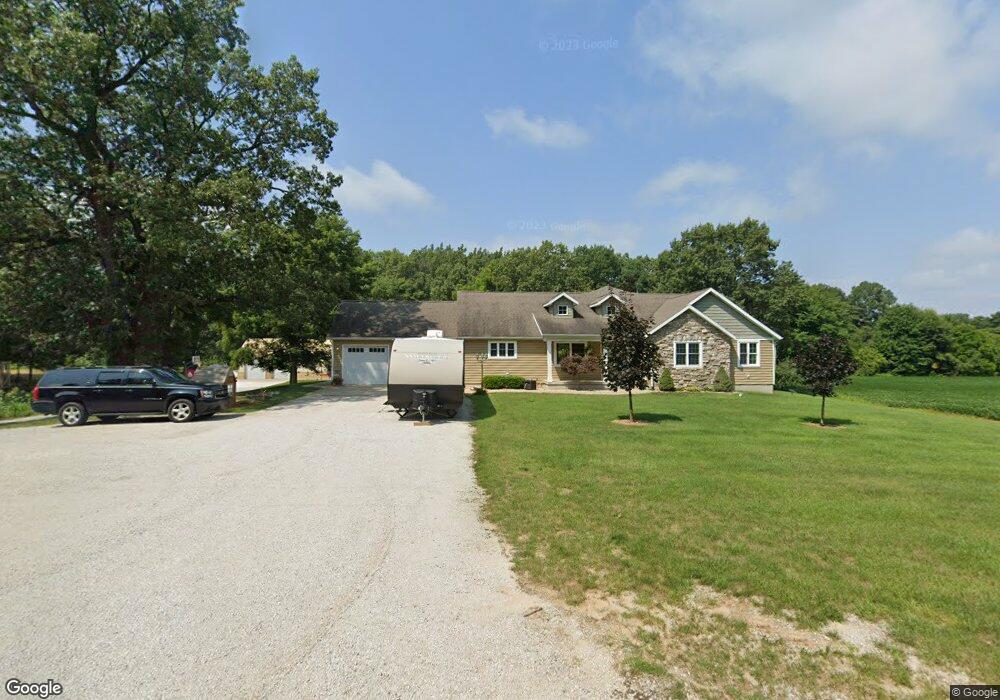
About This Home
This home is located at 4215 S 100 E, Knox, IN 46534 and is currently estimated at $146,209, approximately $169 per square foot. 4215 S 100 E is a home located in Starke County with nearby schools including Knox Community Elementary School, Knox Community Middle School, and Knox Community High School.
Ownership History
Date
Name
Owned For
Owner Type
Purchase Details
Closed on
Dec 28, 2023
Sold by
Stacy Glenn
Bought by
Stacy Corey D and Stacy-Flagg Angela D
Current Estimated Value
Purchase Details
Closed on
Dec 18, 2023
Sold by
Fort Linda J
Bought by
Stacy Corey D and Stacy-Flagg Angela D
Purchase Details
Closed on
Oct 13, 2023
Sold by
Stacy Douglas P
Bought by
Stacy Corey D and Stacy-Flagg Angela D
Purchase Details
Closed on
Jul 24, 2009
Sold by
Stacy Arthur Paul
Bought by
Stacy Corey D and Stacy Jasmine
Create a Home Valuation Report for This Property
The Home Valuation Report is an in-depth analysis detailing your home's value as well as a comparison with similar homes in the area
Home Values in the Area
Average Home Value in this Area
Purchase History
| Date | Buyer | Sale Price | Title Company |
|---|---|---|---|
| Stacy Corey D | -- | None Listed On Document | |
| Stacy Corey D | -- | None Listed On Document | |
| Stacy Corey D | -- | None Listed On Document | |
| Stacy Corey D | -- | Starke County Abstract Inc |
Source: Public Records
Tax History Compared to Growth
Tax History
| Year | Tax Paid | Tax Assessment Tax Assessment Total Assessment is a certain percentage of the fair market value that is determined by local assessors to be the total taxable value of land and additions on the property. | Land | Improvement |
|---|---|---|---|---|
| 2024 | $893 | $60,100 | $18,600 | $41,500 |
| 2023 | $30 | $54,400 | $16,900 | $37,500 |
| 2022 | $852 | $50,100 | $16,200 | $33,900 |
| 2021 | $828 | $43,600 | $16,200 | $27,400 |
| 2020 | $789 | $40,300 | $16,200 | $24,100 |
| 2019 | $810 | $39,500 | $16,200 | $23,300 |
| 2018 | $768 | $37,400 | $14,800 | $22,600 |
| 2017 | $742 | $36,100 | $14,800 | $21,300 |
| 2016 | $726 | $35,300 | $14,800 | $20,500 |
| 2014 | $737 | $38,100 | $14,900 | $23,200 |
| 2013 | $709 | $37,900 | $14,900 | $23,000 |
Source: Public Records
Map
Nearby Homes