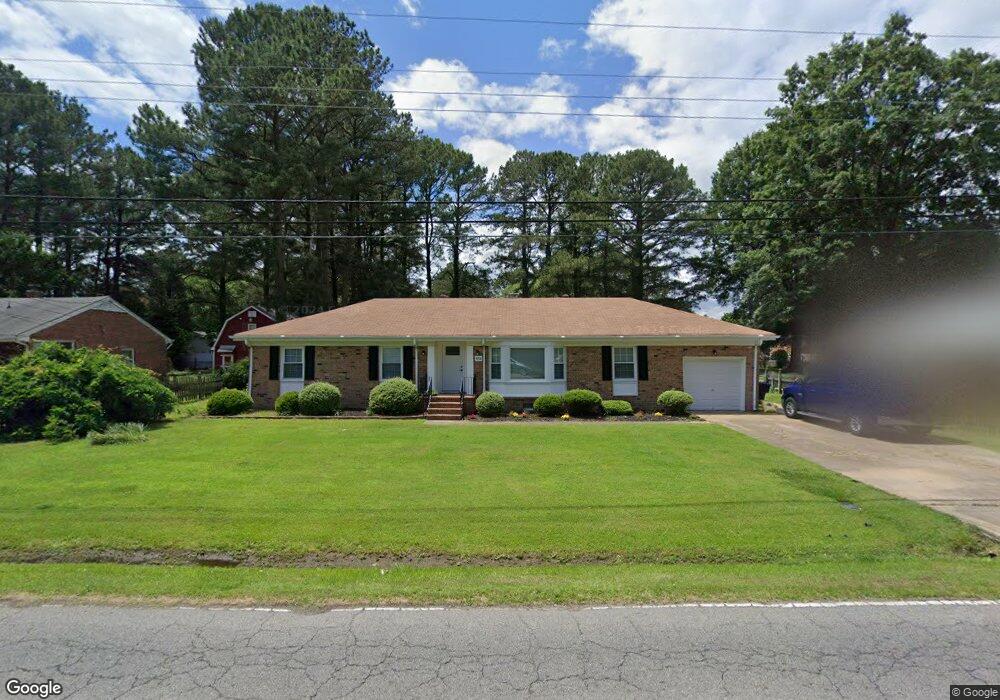
4216 River Shore Rd Portsmouth, VA 23703
Churchland NeighborhoodEstimated Value: $332,229 - $357,000
3
Beds
2
Baths
1,521
Sq Ft
$225/Sq Ft
Est. Value
About This Home
This home is located at 4216 River Shore Rd, Portsmouth, VA 23703 and is currently estimated at $342,807, approximately $225 per square foot. 4216 River Shore Rd is a home located in Portsmouth City with nearby schools including Churchland Primary/Intermediate School, Churchland Middle School, and Churchland High School.
Ownership History
Date
Name
Owned For
Owner Type
Purchase Details
Closed on
Jun 30, 2023
Sold by
Johnson Dylan J and Johnson Kelsey L
Bought by
Barton Joseph M
Current Estimated Value
Home Financials for this Owner
Home Financials are based on the most recent Mortgage that was taken out on this home.
Original Mortgage
$316,052
Outstanding Balance
$303,706
Interest Rate
4%
Mortgage Type
VA
Estimated Equity
$39,101
Purchase Details
Closed on
Aug 17, 2018
Sold by
Fouts Ross M and Fouts June C
Bought by
Johnson Dylan J and Johnson Kelsey L
Home Financials for this Owner
Home Financials are based on the most recent Mortgage that was taken out on this home.
Original Mortgage
$234,842
Interest Rate
4.5%
Mortgage Type
VA
Purchase Details
Closed on
Feb 6, 2018
Sold by
Booker Jestine S
Bought by
Fouts Ross M and Fouts June C
Create a Home Valuation Report for This Property
The Home Valuation Report is an in-depth analysis detailing your home's value as well as a comparison with similar homes in the area
Home Values in the Area
Average Home Value in this Area
Purchase History
| Date | Buyer | Sale Price | Title Company |
|---|---|---|---|
| Barton Joseph M | $309,400 | Equity Title | |
| Johnson Dylan J | $229,900 | Attorney | |
| Fouts Ross M | $125,000 | Attorney |
Source: Public Records
Mortgage History
| Date | Status | Borrower | Loan Amount |
|---|---|---|---|
| Open | Barton Joseph M | $316,052 | |
| Previous Owner | Johnson Dylan J | $234,842 |
Source: Public Records
Tax History Compared to Growth
Tax History
| Year | Tax Paid | Tax Assessment Tax Assessment Total Assessment is a certain percentage of the fair market value that is determined by local assessors to be the total taxable value of land and additions on the property. | Land | Improvement |
|---|---|---|---|---|
| 2025 | $3,966 | $315,040 | $93,000 | $222,040 |
| 2024 | $3,966 | $308,540 | $93,000 | $215,540 |
| 2023 | $3,613 | $289,060 | $93,000 | $196,060 |
| 2022 | $3,493 | $268,690 | $77,500 | $191,190 |
| 2021 | $3,002 | $230,950 | $62,500 | $168,450 |
| 2020 | $2,964 | $227,970 | $59,520 | $168,450 |
| 2019 | $2,943 | $226,350 | $59,520 | $166,830 |
| 2018 | $2,549 | $196,110 | $59,520 | $136,590 |
| 2017 | $2,549 | $196,110 | $59,520 | $136,590 |
| 2016 | $2,549 | $196,110 | $59,520 | $136,590 |
| 2015 | $2,549 | $196,110 | $59,520 | $136,590 |
| 2014 | $2,491 | $196,110 | $59,520 | $136,590 |
Source: Public Records
Map
Nearby Homes
- 4028 Swannanoa Dr
- 4232 Summerset Dr
- 4224 Burnham Dr
- 4200 Quince Rd
- 5606 Gregory Ct
- 5728 Hawthorne Ln
- 5833 Hawthorne Ln
- 4008 Oakhurst Rd
- 5693 Rivermill Cir
- 5807 Dunkin St
- 4444 Southampton Arch
- 4100 Mayfair Way
- 3433 Willow Breeze Dr
- 21 Windy Pines Crescent
- 8 Compass Ct
- 4619 River Shore Rd
- 17 Shoal Ct
- 3860 Sugar Creek Cir
- 5806 Fawkes St
- 10AC Cedar Ln
- 4212 River Shore Rd
- 4220 River Shore Rd
- 4217 Thistle Dr
- 4224 River Shore Rd
- 4208 River Shore Rd
- 4221 Thistle Dr
- 4213 Thistle Dr
- 4225 Thistle Dr
- 4209 Thistle Dr
- 5654 Craneybrook Ln
- 5636 Craneybrook Ln
- 4206 River Shore Rd
- 4229 Thistle Dr
- 4205 Thistle Dr
- 4232 River Shore Rd
- 4216 Thistle Dr
- 4220 Thistle Dr
- 4212 Thistle Dr
- 5700 Craneybrook Ln
- 5704 Craneybrook Ln