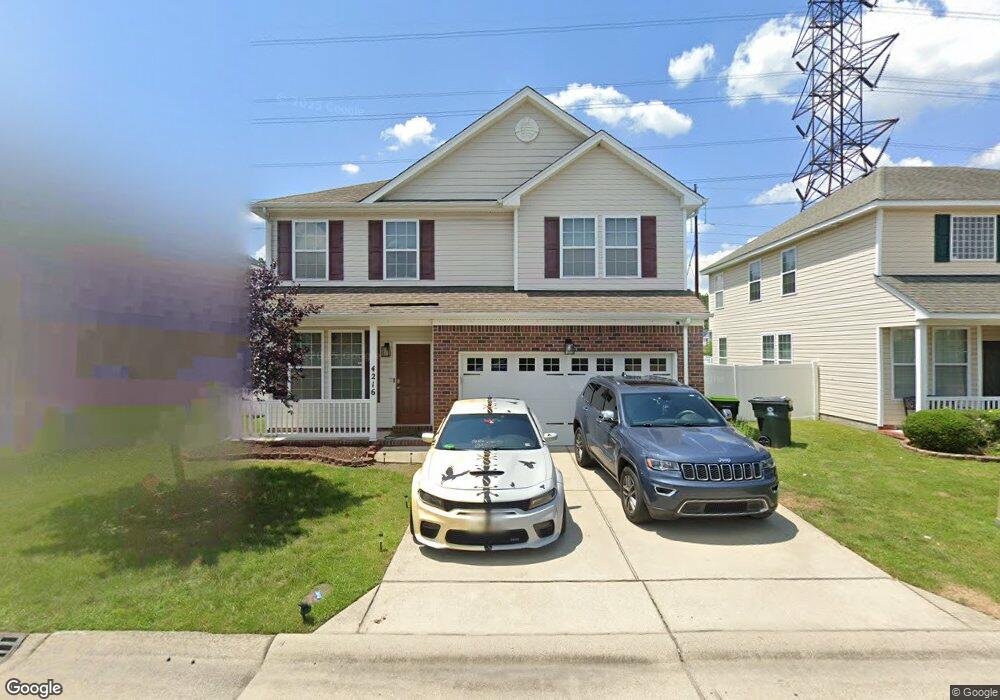
4216 White Cap Crest Chesapeake, VA 23321
Western Branch NeighborhoodEstimated Value: $367,000 - $388,000
4
Beds
3
Baths
2,283
Sq Ft
$166/Sq Ft
Est. Value
About This Home
This home is located at 4216 White Cap Crest, Chesapeake, VA 23321 and is currently estimated at $379,296, approximately $166 per square foot. 4216 White Cap Crest is a home located in Chesapeake City with nearby schools including Southwestern Elementary School, Jolliff Middle School, and Western Branch High School.
Ownership History
Date
Name
Owned For
Owner Type
Purchase Details
Closed on
Apr 19, 2024
Sold by
Watson Wesley W
Bought by
Watson Wesley W and Little Nicole
Current Estimated Value
Purchase Details
Closed on
May 4, 2021
Sold by
Watson Wesley W and Watson Prentice
Bought by
Watson Wesley W
Purchase Details
Closed on
Sep 3, 2019
Sold by
Ortega Yadira
Bought by
Watson Wesley W and Watson Prentice
Home Financials for this Owner
Home Financials are based on the most recent Mortgage that was taken out on this home.
Original Mortgage
$258,950
Interest Rate
3.7%
Mortgage Type
VA
Purchase Details
Closed on
Aug 25, 2010
Sold by
Towne Park Bldg Llc
Bought by
Orteg Yadira
Home Financials for this Owner
Home Financials are based on the most recent Mortgage that was taken out on this home.
Original Mortgage
$253,400
Interest Rate
4.57%
Mortgage Type
VA
Create a Home Valuation Report for This Property
The Home Valuation Report is an in-depth analysis detailing your home's value as well as a comparison with similar homes in the area
Home Values in the Area
Average Home Value in this Area
Purchase History
| Date | Buyer | Sale Price | Title Company |
|---|---|---|---|
| Watson Wesley W | -- | Stewart Title | |
| Watson Wesley W | -- | Stewart Title | |
| Watson Wesley W | -- | None Available | |
| Watson Wesley W | $253,500 | Bay Area Title & Assoc Inc | |
| Orteg Yadira | $248,080 | -- |
Source: Public Records
Mortgage History
| Date | Status | Borrower | Loan Amount |
|---|---|---|---|
| Previous Owner | Watson Wesley W | $258,950 | |
| Previous Owner | Orteg Yadira | $253,400 |
Source: Public Records
Tax History Compared to Growth
Tax History
| Year | Tax Paid | Tax Assessment Tax Assessment Total Assessment is a certain percentage of the fair market value that is determined by local assessors to be the total taxable value of land and additions on the property. | Land | Improvement |
|---|---|---|---|---|
| 2025 | $3,431 | $375,200 | $100,000 | $275,200 |
| 2024 | $3,431 | $339,700 | $95,000 | $244,700 |
| 2023 | $2,990 | $327,200 | $85,000 | $242,200 |
| 2022 | $2,978 | $294,900 | $75,000 | $219,900 |
| 2021 | $2,697 | $256,900 | $65,000 | $191,900 |
| 2020 | $2,586 | $246,300 | $60,000 | $186,300 |
| 2019 | $2,567 | $244,500 | $60,000 | $184,500 |
| 2018 | $2,567 | $235,000 | $55,000 | $180,000 |
| 2017 | $2,520 | $240,000 | $60,000 | $180,000 |
| 2016 | $2,520 | $240,000 | $60,000 | $180,000 |
| 2015 | $2,430 | $231,400 | $55,000 | $176,400 |
| 2014 | $2,468 | $235,000 | $55,000 | $180,000 |
Source: Public Records
Map
Nearby Homes
- 4195 Taughtline Loop
- 4336 Schooner Trail
- 4305 Mast Head Way
- 1704 Sandy Pines Ct
- 1800 Whites Landing
- 3912 Holly Cove Dr
- 4227 Meander Way
- 3931 Port Rd
- 3861 Ahoy Dr
- 4052 Sunkist Rd
- 3940 Starboard Rd
- 4004 River Breeze Cir
- 4026 River Breeze Cir
- 4044 Devon Dr
- 3725 Bosun Dr
- 407 Bobby Jones Dr
- 409 Holloway Dr
- 305 Bobby Jones Dr
- 7.7 Sondej Ave
- MM Magnolia 2 W
- 4216 White Cap Crescent
- 4220 White Cap Crescent
- 4212 White Cap Crescent
- 4212 White Cap Crescent Unit 116
- 4208 White Cap Crescent
- 4208 White Cap Crescent Unit 117
- 4208 White Cap Crest Unit 117
- 4224 White Cap Crescent
- 4224 White Cap Crescent Unit 113
- 4215 White Cap Crescent
- 4215 White Cap Crest
- 4211 White Cap Crest
- 4211 White Cap Crescent
- 4219 White Cap Crescent
- 4204 White Cap Crescent
- 4204 White Cap Crest Unit 118
- 4204 White Cap Crescent Unit 118
- 4228 White Cap Crescent
- 4228 White Cap Crest
- 4200 White Cap Crescent