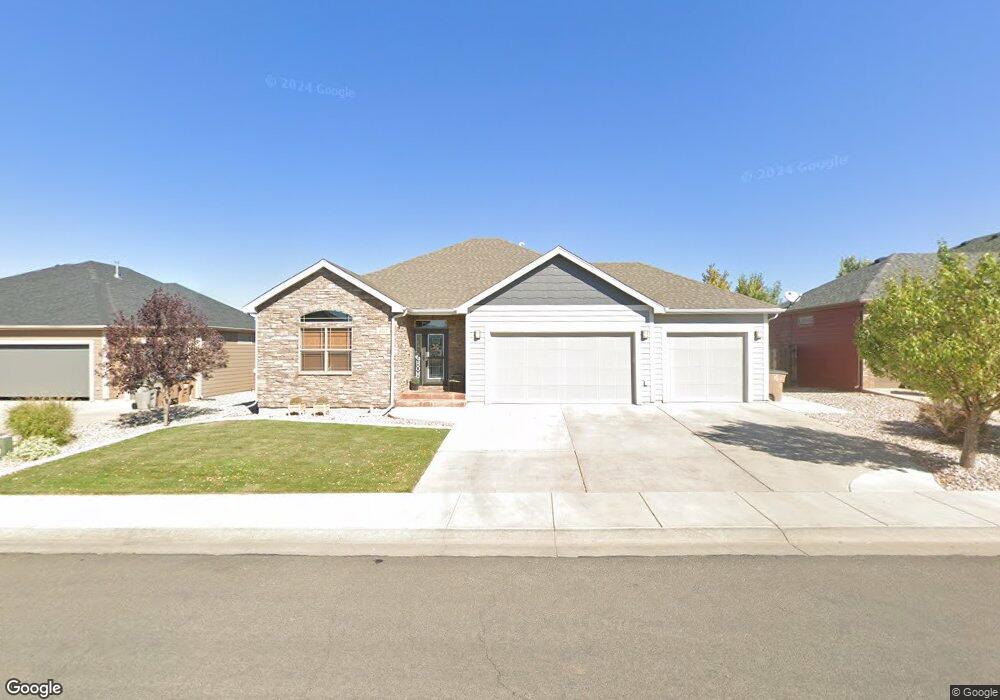
4217 Bobolink Ln Laramie, WY 82070
Estimated Value: $491,000 - $581,000
3
Beds
2
Baths
1,665
Sq Ft
$331/Sq Ft
Est. Value
About This Home
This home is located at 4217 Bobolink Ln, Laramie, WY 82070 and is currently estimated at $551,472, approximately $331 per square foot. 4217 Bobolink Ln is a home located in Albany County with nearby schools including Beitel Elementary School, Laramie Middle School, and Laramie High School.
Ownership History
Date
Name
Owned For
Owner Type
Purchase Details
Closed on
Feb 16, 2023
Sold by
Knaub Troy L and Knaub Joell
Bought by
Knaub Revocable Trust
Current Estimated Value
Purchase Details
Closed on
Jun 24, 2008
Sold by
Austin And Taylor Homes Llc
Bought by
Knub Troy L and Knub Joell
Home Financials for this Owner
Home Financials are based on the most recent Mortgage that was taken out on this home.
Original Mortgage
$277,110
Interest Rate
6.11%
Mortgage Type
New Conventional
Purchase Details
Closed on
Oct 5, 2007
Sold by
Country Club Llc
Bought by
Austin & Taylor Homes Llc
Home Financials for this Owner
Home Financials are based on the most recent Mortgage that was taken out on this home.
Original Mortgage
$55,000
Interest Rate
6.47%
Mortgage Type
Future Advance Clause Open End Mortgage
Create a Home Valuation Report for This Property
The Home Valuation Report is an in-depth analysis detailing your home's value as well as a comparison with similar homes in the area
Home Values in the Area
Average Home Value in this Area
Purchase History
| Date | Buyer | Sale Price | Title Company |
|---|---|---|---|
| Knaub Revocable Trust | -- | -- | |
| Knub Troy L | -- | -- | |
| Austin & Taylor Homes Llc | -- | Summit Title Services |
Source: Public Records
Mortgage History
| Date | Status | Borrower | Loan Amount |
|---|---|---|---|
| Previous Owner | Knub Troy L | $277,110 | |
| Previous Owner | Austin & Taylor Homes Llc | $55,000 |
Source: Public Records
Tax History Compared to Growth
Tax History
| Year | Tax Paid | Tax Assessment Tax Assessment Total Assessment is a certain percentage of the fair market value that is determined by local assessors to be the total taxable value of land and additions on the property. | Land | Improvement |
|---|---|---|---|---|
| 2025 | $3,698 | $39,348 | $6,893 | $32,455 |
| 2024 | $3,698 | $50,652 | $8,915 | $41,737 |
| 2023 | $3,636 | $49,813 | $7,969 | $41,844 |
| 2022 | $3,295 | $45,140 | $7,451 | $37,689 |
| 2021 | $2,924 | $40,055 | $6,735 | $33,320 |
| 2020 | $2,319 | $31,769 | $6,603 | $25,166 |
| 2019 | $2,180 | $29,859 | $6,257 | $23,602 |
| 2018 | $2,112 | $28,929 | $6,116 | $22,813 |
| 2017 | $2,041 | $27,963 | $6,116 | $21,847 |
| 2016 | $2,018 | $27,648 | $5,724 | $21,924 |
| 2015 | $1,927 | $26,401 | $5,700 | $20,701 |
| 2014 | $1,831 | $25,088 | $0 | $0 |
Source: Public Records
Map
Nearby Homes
- 4223 Moraine St
- 4141 Cliff St
- 4328 Beech St Unit SR1
- 4328 Beech St Unit 7
- 1702 Walsh Ct Unit C
- 4031 Cliff St
- 1916 Peak Cir
- 4039 Bill Nye Ave
- 4037 Bill Nye Ave
- 4033 Bill Nye Ave
- 4029 Bill Nye Ave
- 429 Bill Nye Ave
- 3930 Buckskin Trail
- 3911 Buckskin Trail
- 3834 Buckskin Trail
- 3816 Buckskin Trail
- 4500 E Meadowlark Ln Unit A
- 4609 Meadowlark Ln
- 1501 Arabian Dr
- 1517 Shetland Dr
- 4225 Bobolink Ln
- 4201 Bobolink Ln
- 4222 Moraine St
- 4231 Bobolink Ln
- 4206 Moraine St
- 4206 Bobolink Ln
- 4216 Moraine St
- 4218 Bobolink Ln
- 4208 Moraine St
- 4226 Moraine St
- 4226 Bobolink Ln
- 4137 Bobolink Ln
- 4232 Bobolink Ln
- 4308 Moraine St
- 4134 Moraine St
- 4211 Moraine St
- 4136 Bobolink Ln
- 4132 Moraine St
- 4217 Foothills St
- 4310 Bobolink Ln