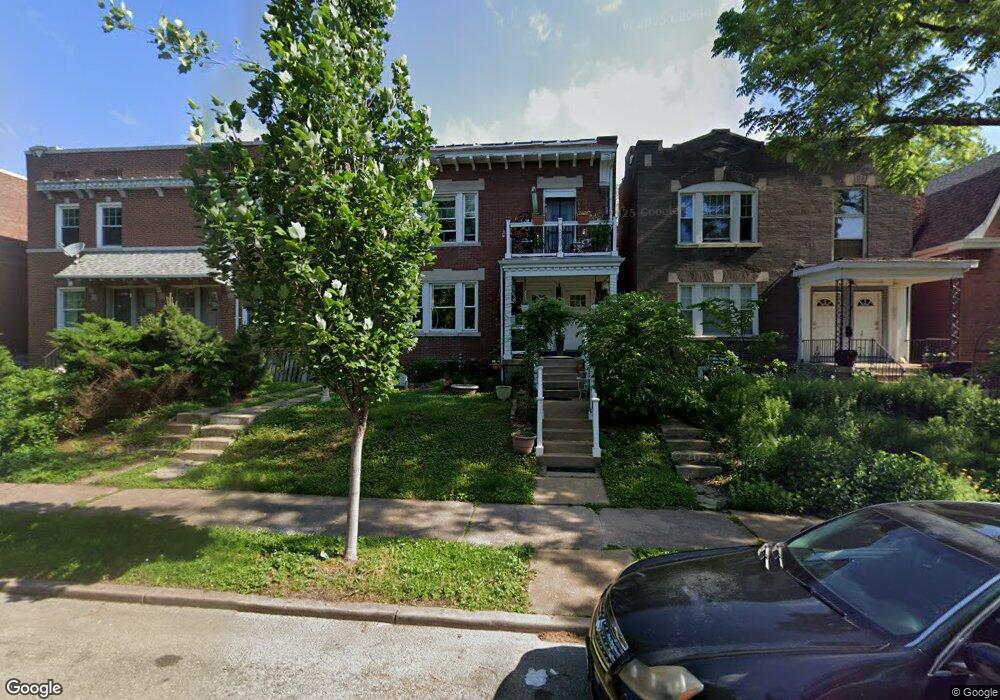
4217 Hartford St Saint Louis, MO 63116
Tower Grove South NeighborhoodEstimated Value: $255,327 - $531,000
--
Bed
2
Baths
2,862
Sq Ft
$136/Sq Ft
Est. Value
About This Home
This home is located at 4217 Hartford St, Saint Louis, MO 63116 and is currently estimated at $390,082, approximately $136 per square foot. 4217 Hartford St is a home located in St. Louis City with nearby schools including Mann Elementary School, Roosevelt High School, and Momentum Academy Tower Grove East.
Ownership History
Date
Name
Owned For
Owner Type
Purchase Details
Closed on
Aug 31, 2012
Sold by
Casa Properties Inc
Bought by
Tamayo Pedro and Jones Allison
Current Estimated Value
Home Financials for this Owner
Home Financials are based on the most recent Mortgage that was taken out on this home.
Original Mortgage
$140,409
Outstanding Balance
$96,790
Interest Rate
3.49%
Mortgage Type
FHA
Estimated Equity
$293,292
Purchase Details
Closed on
Jan 20, 2009
Sold by
Bank Of America National Association
Bought by
Casa Properties Inc
Home Financials for this Owner
Home Financials are based on the most recent Mortgage that was taken out on this home.
Original Mortgage
$64,000
Interest Rate
6%
Mortgage Type
Purchase Money Mortgage
Purchase Details
Closed on
Oct 21, 2008
Sold by
Greer Eugene and Greer Mary E
Bought by
Lasalle Bank Na
Purchase Details
Closed on
Jun 10, 1998
Sold by
Angelia Holloway and Holloway Angelia Holloway
Bought by
Greer Eugene and Greer Mary E
Home Financials for this Owner
Home Financials are based on the most recent Mortgage that was taken out on this home.
Original Mortgage
$57,600
Interest Rate
6.95%
Mortgage Type
Purchase Money Mortgage
Create a Home Valuation Report for This Property
The Home Valuation Report is an in-depth analysis detailing your home's value as well as a comparison with similar homes in the area
Home Values in the Area
Average Home Value in this Area
Purchase History
| Date | Buyer | Sale Price | Title Company |
|---|---|---|---|
| Tamayo Pedro | -- | None Available | |
| Casa Properties Inc | -- | None Available | |
| Lasalle Bank Na | $124,269 | None Available | |
| Greer Eugene | -- | Capital Title |
Source: Public Records
Mortgage History
| Date | Status | Borrower | Loan Amount |
|---|---|---|---|
| Open | Tamayo Pedro | $140,409 | |
| Previous Owner | Casa Properties Inc | $64,000 | |
| Previous Owner | Greer Eugene | $57,600 | |
| Closed | Greer Eugene | $7,200 |
Source: Public Records
Tax History Compared to Growth
Tax History
| Year | Tax Paid | Tax Assessment Tax Assessment Total Assessment is a certain percentage of the fair market value that is determined by local assessors to be the total taxable value of land and additions on the property. | Land | Improvement |
|---|---|---|---|---|
| 2025 | $2,569 | $37,090 | $2,280 | $34,810 |
| 2024 | $2,444 | $30,350 | $2,280 | $28,070 |
| 2023 | $2,444 | $30,350 | $2,280 | $28,070 |
| 2022 | $2,234 | $26,690 | $2,280 | $24,410 |
| 2021 | $2,231 | $26,690 | $2,280 | $24,410 |
| 2020 | $2,032 | $24,470 | $2,280 | $22,190 |
| 2019 | $2,025 | $24,470 | $2,280 | $22,190 |
| 2018 | $1,596 | $17,450 | $2,000 | $15,450 |
| 2017 | $1,471 | $17,440 | $2,000 | $15,450 |
| 2016 | $1,208 | $14,080 | $2,000 | $12,080 |
| 2015 | $1,097 | $14,080 | $2,000 | $12,080 |
| 2014 | $1,016 | $14,080 | $2,000 | $12,080 |
| 2013 | -- | $13,040 | $2,000 | $11,040 |
Source: Public Records
Map
Nearby Homes
- 4223 Hartford St
- 4152 Hartford St
- 4215 Connecticut St
- 4207 Connecticut St
- 4127 Juniata St
- 3125 Morganford Rd
- 4147 Connecticut St
- 4230 Connecticut St
- 3119 Oak Hill Ave
- 4321 Juniata St
- 4250 Wyoming St
- 4400 Arsenal St
- 3209 Morganford Rd
- 3219 Morgan Ford Rd
- 4009 Hartford St
- 4155 Utah St
- 4315 Humphrey St
- 3229 Portis Ave
- 3964 Arsenal St
- 3267 Morganford Rd
- 4215 Hartford St
- 4219 Hartford St
- 4211 Hartford St
- 4223 Hartford 25
- 422325 Hartford
- 4209 Hartford St
- 4225 Hartford St
- 4207 Hartford St
- 4229 Hartford St
- 4203 Hartford St
- 4231 Hartford St
- 4201 Hartford St
- 4201 Hartford St Unit A
- 4216 Arsenal St
- 4212 Arsenal St
- 4222 Arsenal St
- 4210 Arsenal St
- 4208 Arsenal St
- 4235 Hartford St
- 4228 Arsenal St