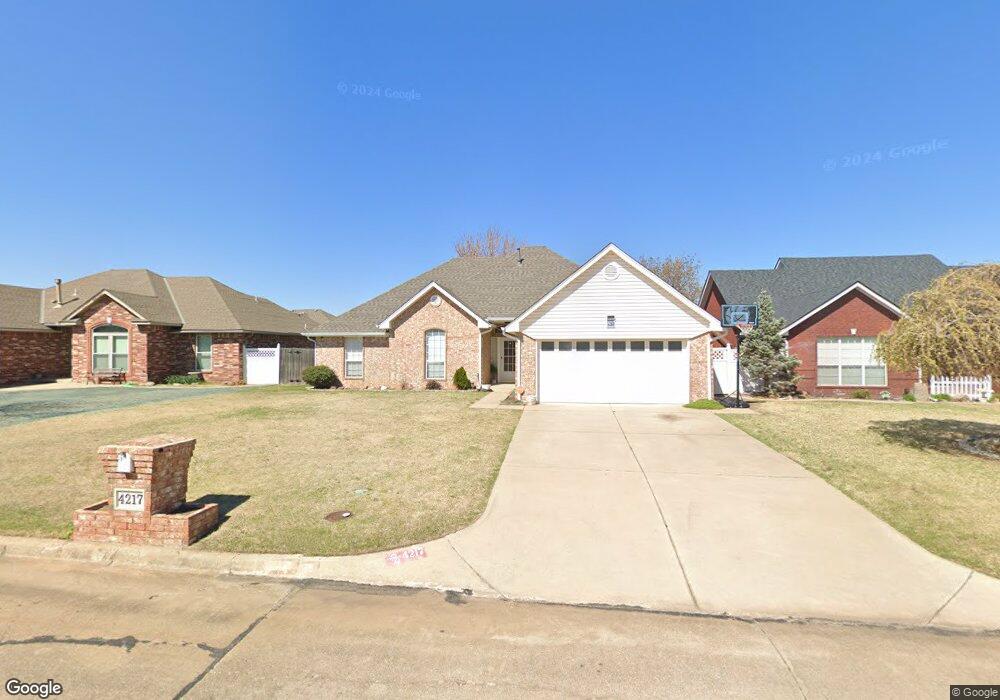
4217 Oakbrook Dr Oklahoma City, OK 73115
Estimated Value: $240,000 - $257,000
3
Beds
2
Baths
1,819
Sq Ft
$136/Sq Ft
Est. Value
About This Home
This home is located at 4217 Oakbrook Dr, Oklahoma City, OK 73115 and is currently estimated at $247,156, approximately $135 per square foot. 4217 Oakbrook Dr is a home located in Oklahoma County with nearby schools including Townsend Elementary School, Kerr Middle School, and Del City High School.
Ownership History
Date
Name
Owned For
Owner Type
Purchase Details
Closed on
Aug 2, 2021
Sold by
Firkins Rosa M and Firkins Rosa M
Bought by
Morris Donald Wayne and Morris Mary M
Current Estimated Value
Home Financials for this Owner
Home Financials are based on the most recent Mortgage that was taken out on this home.
Original Mortgage
$195,000
Outstanding Balance
$177,580
Interest Rate
3%
Mortgage Type
VA
Estimated Equity
$69,576
Purchase Details
Closed on
Oct 14, 1999
Sold by
Firkins Rosa M and Firkins Rosa Marie
Bought by
Firkins Rosa M and Rosa M Firkins Revocable Living Trust
Create a Home Valuation Report for This Property
The Home Valuation Report is an in-depth analysis detailing your home's value as well as a comparison with similar homes in the area
Home Values in the Area
Average Home Value in this Area
Purchase History
| Date | Buyer | Sale Price | Title Company |
|---|---|---|---|
| Morris Donald Wayne | $203,500 | Lincoln Title | |
| Firkins Rosa M | -- | -- |
Source: Public Records
Mortgage History
| Date | Status | Borrower | Loan Amount |
|---|---|---|---|
| Open | Morris Donald Wayne | $195,000 |
Source: Public Records
Tax History Compared to Growth
Tax History
| Year | Tax Paid | Tax Assessment Tax Assessment Total Assessment is a certain percentage of the fair market value that is determined by local assessors to be the total taxable value of land and additions on the property. | Land | Improvement |
|---|---|---|---|---|
| 2024 | $2,617 | $24,436 | $2,670 | $21,766 |
| 2023 | $2,617 | $23,273 | $2,817 | $20,456 |
| 2022 | $2,455 | $22,165 | $3,088 | $19,077 |
| 2021 | $1,536 | $14,391 | $2,226 | $12,165 |
| 2020 | $1,577 | $14,391 | $2,133 | $12,258 |
| 2019 | $1,529 | $14,391 | $2,140 | $12,251 |
| 2018 | $1,551 | $14,392 | $0 | $0 |
| 2017 | $1,562 | $14,391 | $2,252 | $12,139 |
| 2016 | $1,605 | $14,391 | $2,144 | $12,247 |
| 2015 | $1,614 | $14,391 | $2,228 | $12,163 |
| 2014 | $1,610 | $14,390 | $2,260 | $12,130 |
Source: Public Records
Map
Nearby Homes
- 4729 SE 43rd St
- 4732 Princess Ln
- 5225 SE 45th Terrace
- 4625 SE 42nd St
- 4113 Vickie Dr
- 4613 SE 41st St
- 4853 Montclair Dr
- 4728 SE 45th St
- 3500 Del View Dr
- 3413 Del View Dr
- 4704 Tempo Dr
- 4205 Epperly Dr
- 4709 SE 47th St
- 4428 SE 39th St
- 5024 Cinder Dr
- 4428 SE 38th St
- 4540 SE 35th St
- 3128 Del View Dr
- 5309 Eden Dr
- 4809 Elmview Dr
- 4213 Oakbrook Dr
- 4221 Oakbrook Dr
- 4232 Oakbrook Dr
- 4209 Oakbrook Dr
- 4208 Angela Dr
- 4216 Angela Dr
- 4225 Oakbrook Dr
- 4220 Oakbrook Dr
- 4204 Angela Dr
- 4224 Oakbrook Dr
- 4205 Oakbrook Dr
- 4216 Oakbrook Dr
- 4228 Oakbrook Dr
- 4224 Angela Dr
- 4208 Oakbrook Dr
- 4800 SE 41st St
- 4233 Oakbrook Dr
- 4228 Angela Dr
- 4213 Angela Dr
- 4309 Angela Dr