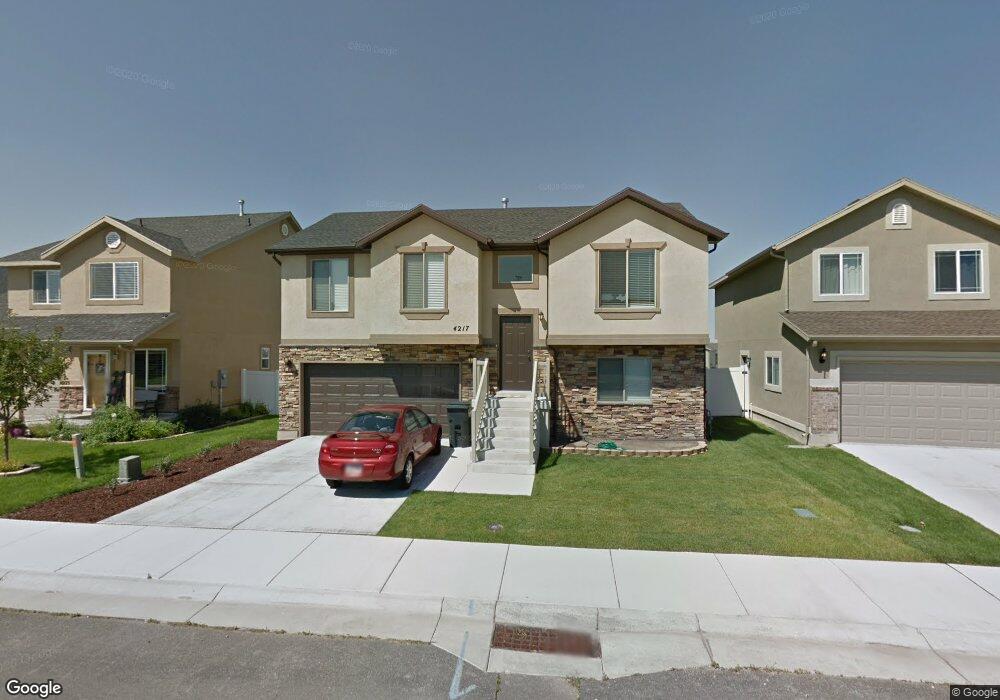
4217 S 3450 W Unit 309 West Haven, UT 84401
Estimated Value: $423,000 - $506,000
3
Beds
2
Baths
1,142
Sq Ft
$394/Sq Ft
Est. Value
About This Home
This home is located at 4217 S 3450 W Unit 309, West Haven, UT 84401 and is currently estimated at $449,874, approximately $393 per square foot. 4217 S 3450 W Unit 309 is a home located in Weber County with nearby schools including West Haven School, Sand Ridge Junior High School, and Roy High School.
Ownership History
Date
Name
Owned For
Owner Type
Purchase Details
Closed on
Mar 1, 2024
Sold by
Kellerstrass Jason Michael
Bought by
Kellerstrass Jason Michael and Kellerstrass Julia A
Current Estimated Value
Home Financials for this Owner
Home Financials are based on the most recent Mortgage that was taken out on this home.
Original Mortgage
$419,500
Outstanding Balance
$412,483
Interest Rate
6.6%
Mortgage Type
New Conventional
Estimated Equity
$37,391
Purchase Details
Closed on
Aug 10, 2021
Sold by
Guinn Heather N and Guinn Zachary M
Bought by
Cevering Trevor and Cevering Leah
Home Financials for this Owner
Home Financials are based on the most recent Mortgage that was taken out on this home.
Original Mortgage
$23,205
Interest Rate
2.9%
Purchase Details
Closed on
Feb 4, 2014
Sold by
Dopf Brandon and Dopf Lisa
Bought by
Guinn Heather N
Home Financials for this Owner
Home Financials are based on the most recent Mortgage that was taken out on this home.
Original Mortgage
$166,819
Interest Rate
4.25%
Mortgage Type
FHA
Purchase Details
Closed on
Dec 14, 2010
Sold by
Scott Carter Construction & Custom Homes
Bought by
Dopf Brandon
Home Financials for this Owner
Home Financials are based on the most recent Mortgage that was taken out on this home.
Original Mortgage
$155,843
Interest Rate
4.62%
Mortgage Type
FHA
Purchase Details
Closed on
Dec 11, 2009
Sold by
Ed Green Construction Inc
Bought by
Scott Carter Construction & Custom Homes
Purchase Details
Closed on
Sep 9, 2008
Sold by
Mark Higley Construction Lc
Bought by
Ed Green Construction Inc
Purchase Details
Closed on
Nov 29, 2005
Sold by
Northern Developers Llc
Bought by
Mark Higley Construction Lc
Home Financials for this Owner
Home Financials are based on the most recent Mortgage that was taken out on this home.
Original Mortgage
$51,926
Interest Rate
6.14%
Mortgage Type
Seller Take Back
Create a Home Valuation Report for This Property
The Home Valuation Report is an in-depth analysis detailing your home's value as well as a comparison with similar homes in the area
Home Values in the Area
Average Home Value in this Area
Purchase History
| Date | Buyer | Sale Price | Title Company |
|---|---|---|---|
| Kellerstrass Jason Michael | -- | Metro Title | |
| Kellerstrass Jason Michael | -- | Old Republic Title | |
| Cevering Trevor | -- | Cottonwood Title | |
| Guinn Heather N | -- | First American Layton | |
| Dopf Brandon | -- | Security Title Of Davis Cnty | |
| Scott Carter Construction & Custom Homes | -- | Security Title Of Davis Cnty | |
| Ed Green Construction Inc | -- | Accommodation | |
| Mark Higley Construction Lc | -- | Heritage West Title Insuranc |
Source: Public Records
Mortgage History
| Date | Status | Borrower | Loan Amount |
|---|---|---|---|
| Open | Kellerstrass Jason Michael | $419,500 | |
| Closed | Kellerstrass Jason Michael | $419,500 | |
| Previous Owner | Cevering Trevor | $23,205 | |
| Previous Owner | Cevering Trevor | $386,764 | |
| Previous Owner | Guinn Heather N | $166,819 | |
| Previous Owner | Dopf Brandon | $155,843 | |
| Previous Owner | Mark Higley Construction Lc | $51,926 | |
| Closed | Scott Carter Construction & Custom Homes | $0 |
Source: Public Records
Tax History Compared to Growth
Tax History
| Year | Tax Paid | Tax Assessment Tax Assessment Total Assessment is a certain percentage of the fair market value that is determined by local assessors to be the total taxable value of land and additions on the property. | Land | Improvement |
|---|---|---|---|---|
| 2025 | $2,591 | $415,239 | $118,433 | $296,806 |
| 2024 | $2,503 | $224,399 | $65,138 | $159,261 |
| 2023 | $2,509 | $223,850 | $65,273 | $158,577 |
| 2022 | $2,414 | $221,650 | $62,597 | $159,053 |
| 2021 | $2,061 | $318,000 | $65,066 | $252,934 |
| 2020 | $1,913 | $271,000 | $50,856 | $220,144 |
| 2019 | $1,830 | $244,000 | $47,551 | $196,449 |
| 2018 | $1,714 | $217,000 | $42,499 | $174,501 |
| 2017 | $1,579 | $192,000 | $45,311 | $146,689 |
| 2016 | $1,416 | $91,791 | $22,785 | $69,006 |
| 2015 | $1,346 | $85,550 | $19,830 | $65,720 |
| 2014 | $1,261 | $77,479 | $19,830 | $57,649 |
Source: Public Records
Map
Nearby Homes
- 4317 S 3350 W
- 4351 W 4000 S
- 4440 Stone Creek Rd Unit 2E
- 3960 S 3375 W
- 3385 W 3950 S
- 4124 S 3560 W
- 3554 W 4100 S Unit 63
- 3084 W 4375 S
- 4491 Haven Creek Rd Unit A
- 3942 S 3450 W
- 3959 S 3485 W
- 3229 W 3855 S
- 4510 Stone Creek Rd Unit F
- 3835 S 3250 W
- 3829 S 3250 W
- 2979 W 4275 S
- 3434 W 4525 S
- 3367 W 3785 S
- Buchanan | Lot 4025 Plan at Salt Point - Legacy
- Buchanan Model Home | Lot 0015 Plan at Salt Point - Legacy
- 4217 S 3450 W
- 4217 S 3450 W Unit 1
- 4223 S 3450 W
- 4209 S 3450 W
- 4227 S 3450 W
- 4227 S 3450 W Unit 307
- 4203 S 3450 W
- 4203 S 3450 W Unit 311
- 4203 S 3450 W Unit 3
- 3428 W 4225 S Unit 359
- 3428 W 4225 S
- 4229 S 3450 W
- 4229 S 3450 W Unit 306
- 3441 W 4225 S Unit 358
- 3441 W 4225 S
- 4195 S 3450 W
- 3384 W 4225 S
- 3384 W 4225 S Unit 360
- 4233 S 3450 W
- 4189 S 3450 W