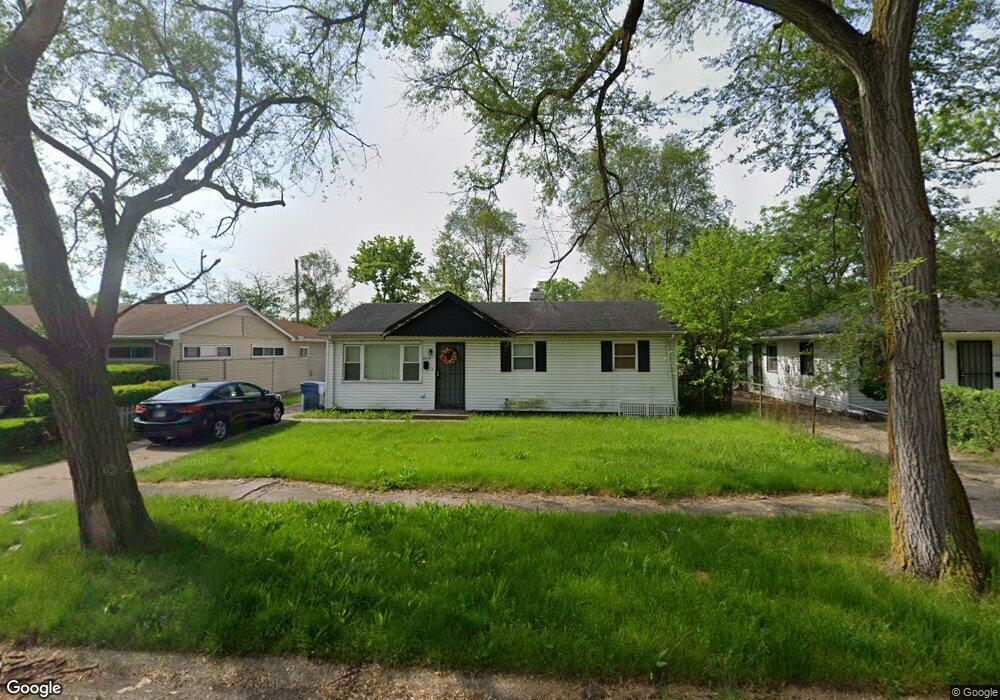
4217 W 21st Place Gary, IN 46404
Tolleston NeighborhoodEstimated Value: $86,929 - $127,000
3
Beds
1
Bath
950
Sq Ft
$109/Sq Ft
Est. Value
About This Home
This home is located at 4217 W 21st Place, Gary, IN 46404 and is currently estimated at $103,232, approximately $108 per square foot. 4217 W 21st Place is a home located in Lake County with nearby schools including Bailly Preparatory Academy, West Side Leadership Academy, and Aspire Charter Academy.
Ownership History
Date
Name
Owned For
Owner Type
Purchase Details
Closed on
Jun 3, 2011
Sold by
Jones Clarence and Jones Jacqueline D
Bought by
Stott Angela
Current Estimated Value
Purchase Details
Closed on
Dec 29, 2010
Sold by
Fannie Mae
Bought by
Jones Clarence and Jones Jaqueline D
Purchase Details
Closed on
Aug 6, 2010
Sold by
Lazar Joan and Lazar Marioara
Bought by
Federal National Mortgage Association
Purchase Details
Closed on
Apr 5, 2008
Sold by
Red Brick Investment Properties Llc
Bought by
Lazar Ioan and Lazar Marioara
Home Financials for this Owner
Home Financials are based on the most recent Mortgage that was taken out on this home.
Original Mortgage
$60,000
Interest Rate
6.32%
Mortgage Type
Purchase Money Mortgage
Purchase Details
Closed on
Apr 14, 2006
Sold by
Fentress Lois R
Bought by
Red Brick Investment Properties Llc
Home Financials for this Owner
Home Financials are based on the most recent Mortgage that was taken out on this home.
Original Mortgage
$34,210
Interest Rate
6.48%
Mortgage Type
Purchase Money Mortgage
Create a Home Valuation Report for This Property
The Home Valuation Report is an in-depth analysis detailing your home's value as well as a comparison with similar homes in the area
Home Values in the Area
Average Home Value in this Area
Purchase History
| Date | Buyer | Sale Price | Title Company |
|---|---|---|---|
| Stott Angela | -- | None Available | |
| Jones Clarence | -- | Statewide Title Company Inc | |
| Federal National Mortgage Association | $67,084 | None Available | |
| Lazar Ioan | -- | None Available | |
| Red Brick Investment Properties Llc | -- | Netco |
Source: Public Records
Mortgage History
| Date | Status | Borrower | Loan Amount |
|---|---|---|---|
| Previous Owner | Lazar Ioan | $60,000 | |
| Previous Owner | Red Brick Investment Properties Llc | $34,210 |
Source: Public Records
Tax History Compared to Growth
Tax History
| Year | Tax Paid | Tax Assessment Tax Assessment Total Assessment is a certain percentage of the fair market value that is determined by local assessors to be the total taxable value of land and additions on the property. | Land | Improvement |
|---|---|---|---|---|
| 2024 | $3,121 | $38,200 | $5,900 | $32,300 |
| 2023 | $781 | $35,400 | $5,900 | $29,500 |
| 2022 | $781 | $30,500 | $3,700 | $26,800 |
| 2021 | $725 | $28,300 | $3,700 | $24,600 |
| 2020 | $705 | $27,500 | $3,700 | $23,800 |
| 2019 | $746 | $23,800 | $3,300 | $20,500 |
| 2018 | $775 | $23,800 | $3,300 | $20,500 |
| 2017 | $566 | $24,100 | $3,300 | $20,800 |
| 2016 | $563 | $25,000 | $3,300 | $21,700 |
| 2014 | $695 | $29,700 | $4,100 | $25,600 |
| 2013 | $656 | $29,200 | $4,100 | $25,100 |
Source: Public Records
Map
Nearby Homes
- 4233 W 22nd Ave
- 4272 W 22nd Ave
- 2083 Williams St
- 4310 W 22nd Place
- 2154 Whitcomb St
- 2135 Clark Rd
- 2016 Wright St
- 4123 W 19th Place
- 4233 W 19th Place
- 1962 Whitcomb St
- 945 - 949 Clark Rd
- 2121 Wallace St
- 2237 Wallace St
- 1930 Wallace St
- 2229 Wallace St
- 3836 W 25th Ave Unit 46
- 2274 Hendricks St
- 968 Baker St
- 1564 Baker St
- 1539 Whitcomb St
- 4225 W 21st Place
- 4209 W 21st Place
- 4218 W 22nd Ave
- 4210 W 22nd Ave
- 4233 W 21st Place
- 4201 W 21st Place
- 4226 W 22nd Ave
- 4202 W 22nd Ave
- 4234 W 22nd Ave
- 4216 W 21st Place
- 4151 W 21st Place
- 4241 W 21st Place
- 4156 W 22nd Ave
- 4208 W 21st Place
- 4232 W 21st Place
- 4242 W 22nd Ave
- 4200 W 21st Place
- 4240 W 21st Place
- 4148 W 22nd Ave
- 4255 W 21st Place