Estimated Value: $476,000 - $487,000
3
Beds
3
Baths
2,188
Sq Ft
$220/Sq Ft
Est. Value
About This Home
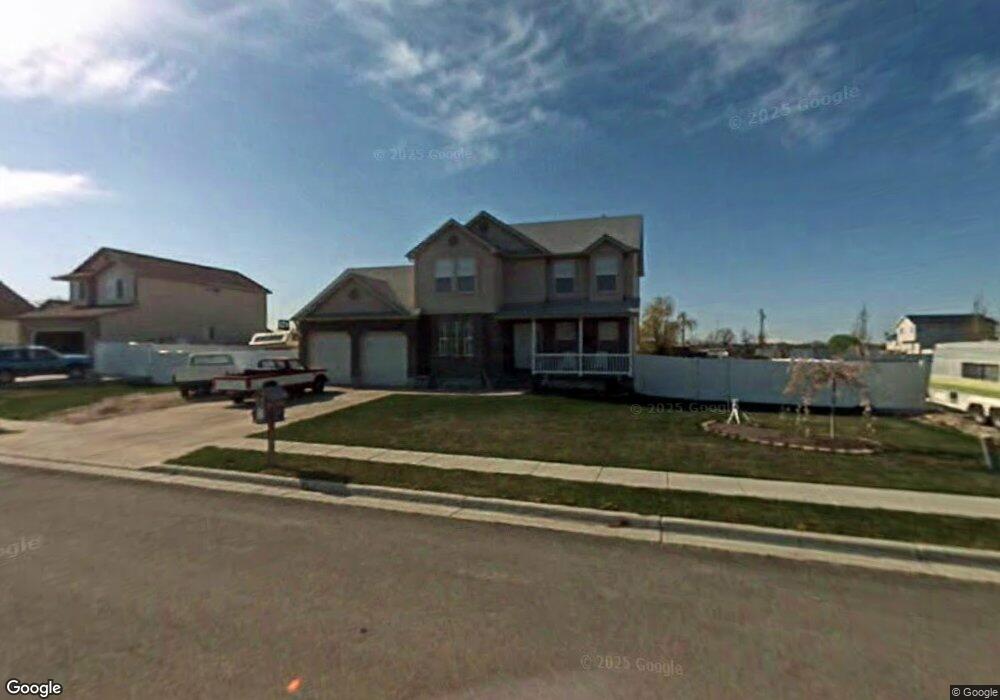
This home is located at 4217 W 5950 S, Roy, UT 84067 and is currently estimated at $480,396, approximately $219 per square foot. 4217 W 5950 S is a home located in Weber County with nearby schools including Freedom School, Roy Junior High School, and Roy High School.
Ownership History
Date
Name
Owned For
Owner Type
Purchase Details
Closed on
May 23, 2019
Sold by
Luthi Mark D and Luthi Tamara R
Bought by
Higginson Bradley
Current Estimated Value
Home Financials for this Owner
Home Financials are based on the most recent Mortgage that was taken out on this home.
Original Mortgage
$302,500
Outstanding Balance
$265,959
Interest Rate
4.2%
Mortgage Type
VA
Estimated Equity
$214,437
Purchase Details
Closed on
Jan 9, 2002
Sold by
Ruplinger Michael K
Bought by
Luthi Mark D and Luthi Tamara R
Home Financials for this Owner
Home Financials are based on the most recent Mortgage that was taken out on this home.
Original Mortgage
$130,000
Interest Rate
7.01%
Purchase Details
Closed on
Jul 17, 2000
Sold by
D & R Development Lc
Bought by
Ruplinger Michael K
Home Financials for this Owner
Home Financials are based on the most recent Mortgage that was taken out on this home.
Original Mortgage
$112,500
Interest Rate
8.37%
Create a Home Valuation Report for This Property
The Home Valuation Report is an in-depth analysis detailing your home's value as well as a comparison with similar homes in the area
Home Values in the Area
Average Home Value in this Area
Purchase History
| Date | Buyer | Sale Price | Title Company |
|---|---|---|---|
| Higginson Bradley | -- | Metro National Title | |
| Luthi Mark D | -- | First American Title | |
| Ruplinger Michael K | -- | Bonneville Title Company |
Source: Public Records
Mortgage History
| Date | Status | Borrower | Loan Amount |
|---|---|---|---|
| Open | Higginson Bradley | $302,500 | |
| Previous Owner | Luthi Mark D | $130,000 | |
| Previous Owner | Ruplinger Michael K | $112,500 | |
| Closed | Ruplinger Michael K | $8,250 |
Source: Public Records
Tax History
| Year | Tax Paid | Tax Assessment Tax Assessment Total Assessment is a certain percentage of the fair market value that is determined by local assessors to be the total taxable value of land and additions on the property. | Land | Improvement |
|---|---|---|---|---|
| 2025 | $2,853 | $455,325 | $155,015 | $300,310 |
| 2024 | $2,787 | $246,399 | $85,258 | $161,141 |
| 2023 | $2,948 | $263,450 | $85,194 | $178,256 |
| 2022 | $2,773 | $253,000 | $68,751 | $184,249 |
| 2021 | $2,398 | $361,000 | $85,012 | $275,988 |
| 2020 | $2,237 | $309,000 | $85,012 | $223,988 |
| 2019 | $2,140 | $278,000 | $55,035 | $222,965 |
| 2018 | $2,089 | $256,000 | $55,035 | $200,965 |
| 2017 | $1,953 | $224,000 | $55,035 | $168,965 |
| 2016 | $1,898 | $117,223 | $30,199 | $87,024 |
| 2015 | $1,724 | $108,728 | $30,199 | $78,529 |
| 2014 | $1,740 | $108,728 | $30,199 | $78,529 |
Source: Public Records
Map
Nearby Homes
- 4264 W 6025 S
- 4276 W 6025 S
- 6052 S 4275 W
- 4062 W 5950 S
- 3016 W 2650 N
- 3186 W 2600 N
- 3027 W 2600 N
- 4450 W 5775 S
- 4403 W 5700 S
- 2542 N 3300 W
- 5645 S 4525 W
- 4641 W 5675 S
- 5444 S 4050 W
- 339 N 3250 W Unit 12
- 2216 W 2615 N Unit 142
- 2208 W 2615 N
- 2208 W 2615 N Unit 141
- 2186 W 2615 N
- 2186 W 2615 N Unit 139
- 2434 W 2250 N
- 4203 W 5950 S
- 4203 W 5950 S Unit 8
- 4233 W 5950 S
- 4216 W 5950 S
- 4191 W 5950 S
- 4191 W 5950 S Unit 7
- 4232 W 5950 S
- 4232 W 5950 S Unit 37
- 4249 W 5950 S
- 4249 W 5950 S Unit 41
- 5974 S 4250 W
- 5974 S 4250 W Unit 42
- 4204 W 5950 S
- 4202 W 6000 S
- 4182 W 6000 S
- 4248 W 5950 S
- 4190 W 5950 S
- 5986 S 4250 W Unit LOT 43
- 4177 W 5950 S
- 4231 W 5900 S
Your Personal Tour Guide
Ask me questions while you tour the home.