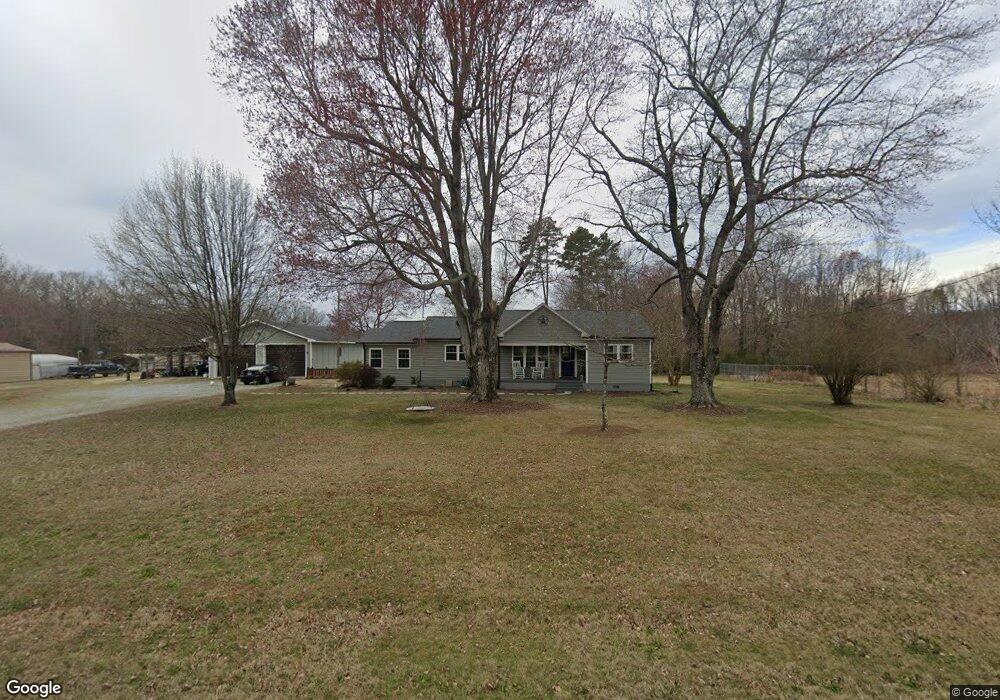
4218 N Nc Highway 119 Mebane, NC 27302
Estimated Value: $446,512 - $503,000
3
Beds
3
Baths
1,652
Sq Ft
$283/Sq Ft
Est. Value
About This Home
This home is located at 4218 N Nc Highway 119, Mebane, NC 27302 and is currently estimated at $468,128, approximately $283 per square foot. 4218 N Nc Highway 119 is a home located in Alamance County with nearby schools including E.M. Yoder Elementary School, Woodlawn Middle School, and Eastern Alamance High School.
Ownership History
Date
Name
Owned For
Owner Type
Purchase Details
Closed on
Dec 4, 2024
Sold by
Jones Michael F
Bought by
Gunn Darcy F
Current Estimated Value
Home Financials for this Owner
Home Financials are based on the most recent Mortgage that was taken out on this home.
Original Mortgage
$306,000
Outstanding Balance
$302,714
Interest Rate
5.13%
Mortgage Type
New Conventional
Estimated Equity
$165,414
Purchase Details
Closed on
Oct 12, 2020
Sold by
Rfd Property Solutions Llc
Bought by
Jones Michael and Gunn Darcy
Home Financials for this Owner
Home Financials are based on the most recent Mortgage that was taken out on this home.
Original Mortgage
$260,560
Interest Rate
2.9%
Mortgage Type
New Conventional
Purchase Details
Closed on
May 15, 2020
Sold by
Scott David Keith and Scott Donna
Bought by
Rfd Property Solutions Llc and Amc2 Investments Llc
Purchase Details
Closed on
Jan 1, 1990
Bought by
Scott C H Louise
Create a Home Valuation Report for This Property
The Home Valuation Report is an in-depth analysis detailing your home's value as well as a comparison with similar homes in the area
Home Values in the Area
Average Home Value in this Area
Purchase History
| Date | Buyer | Sale Price | Title Company |
|---|---|---|---|
| Gunn Darcy F | -- | None Listed On Document | |
| Jones Michael | $326,000 | None Available | |
| Rfd Property Solutions Llc | $125,000 | None Available | |
| Scott C H Louise | -- | -- |
Source: Public Records
Mortgage History
| Date | Status | Borrower | Loan Amount |
|---|---|---|---|
| Open | Gunn Darcy F | $306,000 | |
| Previous Owner | Jones Michael | $260,560 |
Source: Public Records
Tax History Compared to Growth
Tax History
| Year | Tax Paid | Tax Assessment Tax Assessment Total Assessment is a certain percentage of the fair market value that is determined by local assessors to be the total taxable value of land and additions on the property. | Land | Improvement |
|---|---|---|---|---|
| 2025 | $1,979 | $333,092 | $61,957 | $271,135 |
| 2024 | $1,839 | $333,092 | $61,957 | $271,135 |
| 2023 | $1,707 | $333,092 | $61,957 | $271,135 |
| 2022 | $1,037 | $135,369 | $52,967 | $82,402 |
| 2021 | $1,018 | $135,369 | $52,967 | $82,402 |
| 2020 | $1,037 | $135,369 | $52,967 | $82,402 |
| 2019 | $1,042 | $135,369 | $52,967 | $82,402 |
| 2018 | $0 | $135,369 | $52,967 | $82,402 |
| 2017 | $921 | $135,369 | $52,967 | $82,402 |
| 2016 | $904 | $132,889 | $40,177 | $92,712 |
| 2015 | $873 | $132,889 | $40,177 | $92,712 |
| 2014 | $807 | $132,889 | $40,177 | $92,712 |
Source: Public Records
Map
Nearby Homes
- 942 Steep Meadow Ln
- 5365 N Nc Highway 49
- 6050 Country Highland Ln
- 3610 Barnett Rd
- 7284 State Highway 49
- 2830 Barnett Rd
- 2848 John Lewis Rd
- 2819 John Lewis Rd
- Lot 15 Crumpton Trail
- Lot 14 Crumpton Trail
- 2533 Holly Brook Dr
- 7275 Atkins Rd
- 5160 Virginia Pine Trail
- 0 Lyla's Ln Unit 1171388
- 0 Lyla's Ln Unit 1169903
- 0 Lylas Ln
- 2776 Pleasant Grove Union School Rd
- 0 Mckinley St Unit 2537738
- 2007 Miles Chapel Rd
- 0 Doc Corbett Rd
- 4262 N Nc Highway 119
- 4258 N Nc Highway 119
- 4218 N Nc Highway 119
- 4248 N Nc Highway 119
- 4207 N Nc Highway 119
- 4218 N Nc Highway 119
- 3105 Bo Fuller Rd
- 5715 Christys Ln
- 5771 Christys Ln
- 5803 Christys Ln
- 3257 Bo Fuller Rd
- 3257 Bo Fuller Rd Unit unknown
- 3257 Bo Fuller Rd
- 5807 Christys Ln
- 0 Christys Ln
- 3263 Bo Fuller Rd
- 5811 Christys Ln
- 5911 Christys Ln
- 5914 Christys Ln
- 3287 Bo Fuller Rd