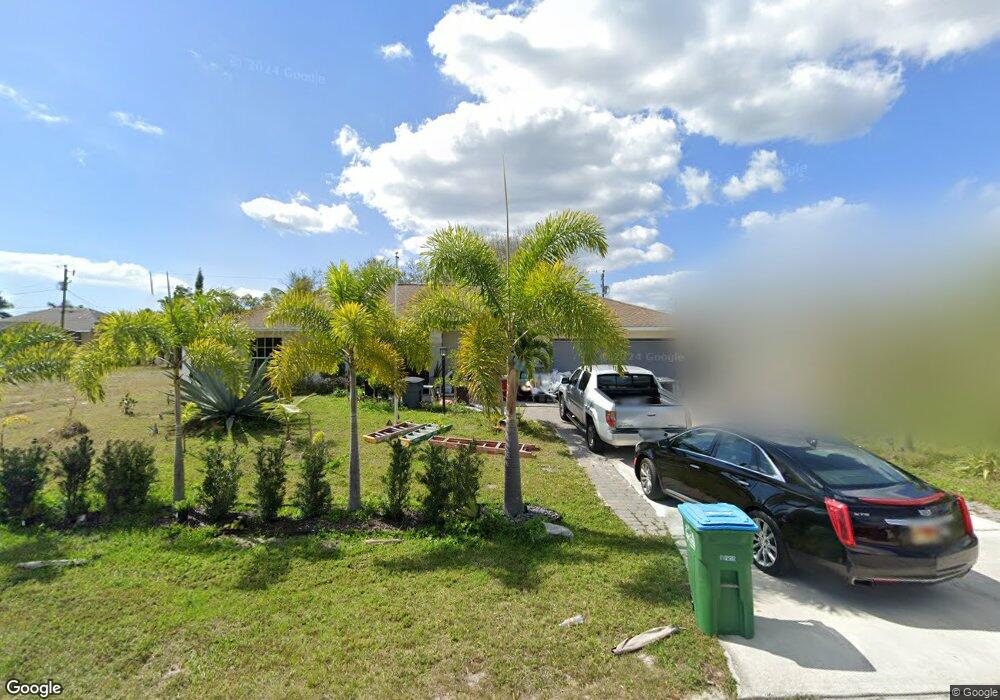
4218 SW 14th Place Unit 65 Cape Coral, FL 33914
Pelican NeighborhoodEstimated Value: $265,000 - $349,000
3
Beds
2
Baths
1,417
Sq Ft
$213/Sq Ft
Est. Value
About This Home
This home is located at 4218 SW 14th Place Unit 65, Cape Coral, FL 33914 and is currently estimated at $301,314, approximately $212 per square foot. 4218 SW 14th Place Unit 65 is a home located in Lee County with nearby schools including Cape Elementary School, Caloosa Elementary School, and Tropic Isles Elementary School.
Ownership History
Date
Name
Owned For
Owner Type
Purchase Details
Closed on
Oct 12, 2020
Sold by
Stark Elizabeth and Tulik Erwin
Bought by
Stark Elizabeth and Russo Lidia
Current Estimated Value
Purchase Details
Closed on
Sep 25, 2019
Sold by
Russo Lidia
Bought by
Stark Elizabeth and Tulik Irwin
Purchase Details
Closed on
Oct 4, 2011
Sold by
Ob Florida Rre Holdings Llc
Bought by
Russo Lidia V
Home Financials for this Owner
Home Financials are based on the most recent Mortgage that was taken out on this home.
Original Mortgage
$65,600
Interest Rate
4.26%
Mortgage Type
New Conventional
Purchase Details
Closed on
May 4, 2011
Sold by
Barahona Filander Antonio
Bought by
Ob Florida Rre Holdings Llc
Purchase Details
Closed on
Jun 28, 2005
Sold by
Barahona Corina
Bought by
Barahona Filander Antonio and Barahona Corina
Create a Home Valuation Report for This Property
The Home Valuation Report is an in-depth analysis detailing your home's value as well as a comparison with similar homes in the area
Home Values in the Area
Average Home Value in this Area
Purchase History
| Date | Buyer | Sale Price | Title Company |
|---|---|---|---|
| Stark Elizabeth | -- | Accommodation | |
| Stark Elizabeth | -- | Accommodation | |
| Russo Lidia V | $82,000 | Attorney | |
| Ob Florida Rre Holdings Llc | $2,200 | Attorney | |
| Barahona Filander Antonio | -- | Guardian Title Services Corp |
Source: Public Records
Mortgage History
| Date | Status | Borrower | Loan Amount |
|---|---|---|---|
| Previous Owner | Russo Lidia V | $65,600 |
Source: Public Records
Tax History Compared to Growth
Tax History
| Year | Tax Paid | Tax Assessment Tax Assessment Total Assessment is a certain percentage of the fair market value that is determined by local assessors to be the total taxable value of land and additions on the property. | Land | Improvement |
|---|---|---|---|---|
| 2025 | $3,199 | $194,765 | -- | -- |
| 2024 | $3,064 | $189,276 | -- | -- |
| 2023 | $3,064 | $183,763 | $0 | $0 |
| 2022 | $2,842 | $178,411 | $0 | $0 |
| 2021 | $2,873 | $173,215 | $41,279 | $131,936 |
| 2020 | $3,385 | $156,653 | $30,000 | $126,653 |
| 2019 | $3,212 | $148,576 | $30,000 | $118,576 |
| 2018 | $3,250 | $150,191 | $25,000 | $125,191 |
| 2017 | $3,112 | $146,170 | $20,000 | $126,170 |
| 2016 | $2,847 | $129,547 | $20,000 | $109,547 |
| 2015 | $2,606 | $110,100 | $15,200 | $94,900 |
| 2014 | -- | $102,604 | $13,800 | $88,804 |
| 2013 | -- | $90,897 | $11,500 | $79,397 |
Source: Public Records
Map
Nearby Homes
- 4213 SW 15th Ave
- 2303 SW 43rd Terrace
- 4125 SW 15th Ave
- 1515 SW 43rd Terrace
- 1300 SW 43rd St
- 3525-3529 Chiquita Blvd S
- 1600 Beach Pkwy W
- 4125 Chiquita Blvd S
- 1521 SW 43rd Ln
- 1518 SW 43rd Ln
- 4317 SW 16th Place
- 4304 SW 16th Place
- 4333 SW 16th Place
- 4404 SW 15th Place
- 1626 SW 43rd St
- 4413 SW 15th Place
- 4218 SW 17th Ave
- 4015 Chiquita Blvd S
- 4402 SW 12th Place
- 1708 Beach Pkwy W
- 4214 SW 14th Place
- 4217 SW 15th Ave
- 4221 SW 15th Ave
- 4226 SW 14th Place
- 4210 SW 14th Place
- 4217 SW 14th Place
- 4221 SW 14th Place
- 4225 SW 15th Ave
- 4213 SW 14th Place
- 4209 SW 15th Ave
- 4206 SW 14th Place
- 4230 SW 14th Place Unit 65
- 4209 SW 14th Place Unit 65
- 4229 SW 15th Ave
- 4205 SW 15th Ave
- 4218 SW 14th Ave
- 4216 SW 15th Ave Unit 63
- 4220 SW 15th Ave
- 4222 SW 14th Ave