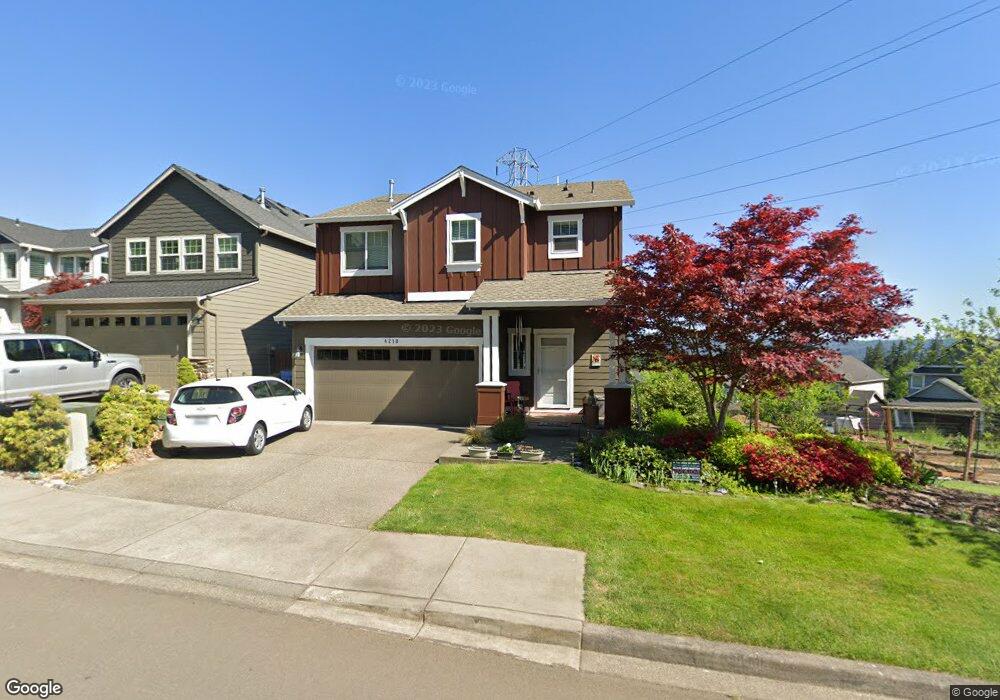
4218 Y St Washougal, WA 98671
Estimated Value: $579,529 - $686,000
3
Beds
3
Baths
1,983
Sq Ft
$312/Sq Ft
Est. Value
About This Home
This home is located at 4218 Y St, Washougal, WA 98671 and is currently estimated at $619,382, approximately $312 per square foot. 4218 Y St is a home located in Clark County with nearby schools including Gause Elementary School, Jemtegaard Middle School, and Washougal High School.
Ownership History
Date
Name
Owned For
Owner Type
Purchase Details
Closed on
Sep 14, 2021
Sold by
Krebsbach Eugene W
Bought by
Krebsbach Eugene W and Krebsbach Jr Trust
Current Estimated Value
Purchase Details
Closed on
Nov 25, 2013
Sold by
D R Horton Inc Portland
Bought by
Krebsbach Eugene W
Purchase Details
Closed on
Nov 22, 2013
Sold by
Moran Patricia
Bought by
Krebsbach Eugene W
Purchase Details
Closed on
Mar 29, 2013
Sold by
Karlsen Development Llc
Bought by
D R Horton Inc Portland
Purchase Details
Closed on
Aug 8, 2006
Sold by
C/P 1-97 Washougal Joint Venture
Bought by
Karlsen Development Llc
Create a Home Valuation Report for This Property
The Home Valuation Report is an in-depth analysis detailing your home's value as well as a comparison with similar homes in the area
Home Values in the Area
Average Home Value in this Area
Purchase History
| Date | Buyer | Sale Price | Title Company |
|---|---|---|---|
| Krebsbach Eugene W | -- | None Available | |
| Krebsbach Eugene W | $262,626 | Chicago Title | |
| Krebsbach Eugene W | -- | Chicago Title | |
| D R Horton Inc Portland | $250,000 | Chicago Title Insurance | |
| Karlsen Development Llc | $608,700 | Chicago Title Insurance |
Source: Public Records
Tax History Compared to Growth
Tax History
| Year | Tax Paid | Tax Assessment Tax Assessment Total Assessment is a certain percentage of the fair market value that is determined by local assessors to be the total taxable value of land and additions on the property. | Land | Improvement |
|---|---|---|---|---|
| 2025 | $4,885 | $507,400 | $120,000 | $387,400 |
| 2024 | $4,768 | $514,969 | $144,000 | $370,969 |
| 2023 | $4,654 | $526,076 | $154,800 | $371,276 |
| 2022 | $4,612 | $502,752 | $154,800 | $347,952 |
| 2021 | $4,497 | $432,372 | $132,000 | $300,372 |
| 2020 | $2,129 | $395,632 | $120,000 | $275,632 |
| 2019 | $3,591 | $380,579 | $120,000 | $260,579 |
| 2018 | $3,840 | $339,289 | $0 | $0 |
| 2017 | $3,327 | $299,457 | $0 | $0 |
| 2016 | $3,292 | $284,917 | $0 | $0 |
| 2015 | $3,201 | $257,861 | $0 | $0 |
| 2014 | -- | $249,444 | $0 | $0 |
| 2013 | -- | $218,574 | $0 | $0 |
Source: Public Records
Map
Nearby Homes