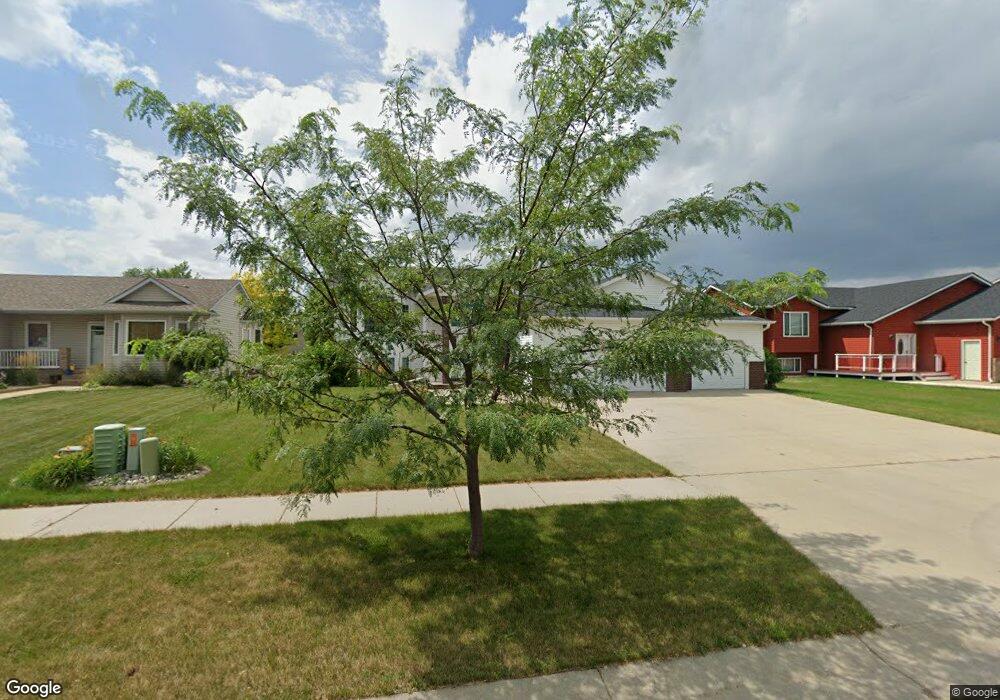
4219 54th St S Fargo, ND 58104
Osgood NeighborhoodEstimated Value: $376,472 - $450,000
--
Bed
--
Bath
1,346
Sq Ft
$312/Sq Ft
Est. Value
About This Home
This home is located at 4219 54th St S, Fargo, ND 58104 and is currently estimated at $420,118, approximately $312 per square foot. 4219 54th St S is a home located in Cass County with nearby schools including Osgood Elementary School, Liberty Middle School, and West Fargo Sheyenne High School.
Ownership History
Date
Name
Owned For
Owner Type
Purchase Details
Closed on
Jun 13, 2006
Sold by
Brad Paul Enterprises Inc
Bought by
Knain Todd L
Current Estimated Value
Home Financials for this Owner
Home Financials are based on the most recent Mortgage that was taken out on this home.
Original Mortgage
$191,300
Outstanding Balance
$113,034
Interest Rate
6.66%
Mortgage Type
New Conventional
Estimated Equity
$307,084
Purchase Details
Closed on
Jun 12, 2006
Sold by
Brad Paul Enterprises Inc
Bought by
Knain Todd L
Home Financials for this Owner
Home Financials are based on the most recent Mortgage that was taken out on this home.
Original Mortgage
$191,300
Outstanding Balance
$113,034
Interest Rate
6.66%
Mortgage Type
New Conventional
Estimated Equity
$307,084
Purchase Details
Closed on
Apr 3, 2006
Sold by
Osgood Investments Llc
Bought by
Brad Paul Enterprises Inc
Create a Home Valuation Report for This Property
The Home Valuation Report is an in-depth analysis detailing your home's value as well as a comparison with similar homes in the area
Home Values in the Area
Average Home Value in this Area
Purchase History
| Date | Buyer | Sale Price | Title Company |
|---|---|---|---|
| Knain Todd L | $239,164 | -- | |
| Knain Todd L | $239,164 | -- | |
| Brad Paul Enterprises Inc | -- | -- |
Source: Public Records
Mortgage History
| Date | Status | Borrower | Loan Amount |
|---|---|---|---|
| Open | Knain Todd L | $191,300 | |
| Closed | Knain Todd L | $191,300 |
Source: Public Records
Tax History Compared to Growth
Tax History
| Year | Tax Paid | Tax Assessment Tax Assessment Total Assessment is a certain percentage of the fair market value that is determined by local assessors to be the total taxable value of land and additions on the property. | Land | Improvement |
|---|---|---|---|---|
| 2024 | $6,246 | $195,400 | $36,600 | $158,800 |
| 2023 | $6,391 | $182,900 | $38,100 | $144,800 |
| 2022 | $6,280 | $170,950 | $38,100 | $132,850 |
| 2021 | $5,835 | $151,950 | $38,100 | $113,850 |
| 2020 | $5,648 | $147,500 | $38,100 | $109,400 |
| 2019 | $5,624 | $147,500 | $23,800 | $123,700 |
| 2018 | $5,519 | $147,500 | $23,800 | $123,700 |
| 2017 | $5,403 | $142,400 | $23,800 | $118,600 |
| 2016 | $4,897 | $129,450 | $23,800 | $105,650 |
| 2015 | $4,866 | $129,450 | $16,200 | $113,250 |
| 2014 | $5,150 | $136,350 | $16,200 | $120,150 |
| 2013 | $5,087 | $127,450 | $16,200 | $111,250 |
Source: Public Records
Map
Nearby Homes
- 4127 52nd St S
- 4272 51st St S
- 4281 Estate Dr S
- 4110 52nd St S
- 9350 & 9124 57th St S
- 5466 Justice Dr S
- 4758 Townsite Place S
- 4723 Clock Tower Ln S
- 4775 Townsite Place S
- 4450 48th St S
- 3676 Crimson Loop S
- 5861 Wildflower Dr S
- 3712 49th St S
- 4891 Foxtail Ln S
- 6023 Wildflower Dr S
- 4868 Bluebell Loop S
- 4824 Decorah Way S
- 6090 Wildflower Dr S
- 4849 Decorah Way S
- 1665 3-Stall Plan at The Residence at Valley View Estates