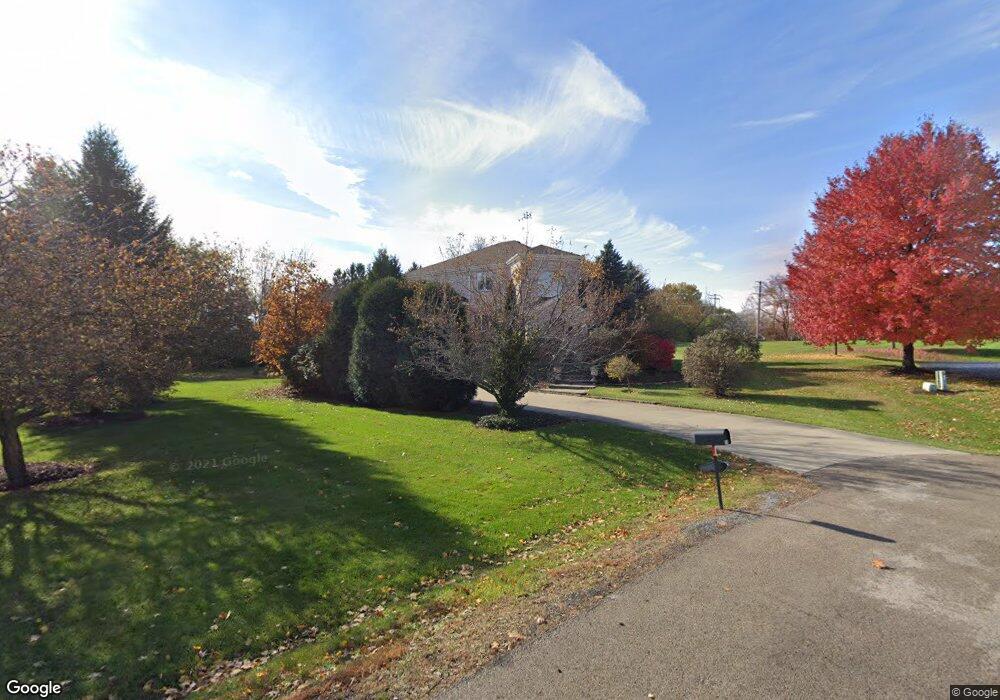
4219 Belson Ln Crystal Lake, IL 60014
Estimated Value: $603,173 - $748,000
4
Beds
4
Baths
3,871
Sq Ft
$170/Sq Ft
Est. Value
About This Home
This home is located at 4219 Belson Ln, Crystal Lake, IL 60014 and is currently estimated at $657,293, approximately $169 per square foot. 4219 Belson Ln is a home located in McHenry County with nearby schools including Coventry Elementary School, Hannah Beardsley Middle School, and Prairie Ridge High School.
Ownership History
Date
Name
Owned For
Owner Type
Purchase Details
Closed on
Aug 31, 2017
Sold by
Kondrat James W
Bought by
Kondrat James W and Kondrat Linda
Current Estimated Value
Purchase Details
Closed on
Dec 27, 2012
Sold by
Kondrat James W and Kondrat Susan A
Bought by
Kondrat James W
Home Financials for this Owner
Home Financials are based on the most recent Mortgage that was taken out on this home.
Original Mortgage
$257,427
Outstanding Balance
$181,068
Interest Rate
3.62%
Mortgage Type
FHA
Estimated Equity
$476,225
Purchase Details
Closed on
Dec 13, 1999
Sold by
Ritter Steven and Ritter Elizabeth
Bought by
Kondrat James W and Kondrat Susan A
Purchase Details
Closed on
Apr 1, 1998
Sold by
White Carnation Ii Inc
Bought by
Ritter Steven and Ritter Elizabeth
Home Financials for this Owner
Home Financials are based on the most recent Mortgage that was taken out on this home.
Original Mortgage
$40,539
Interest Rate
8%
Create a Home Valuation Report for This Property
The Home Valuation Report is an in-depth analysis detailing your home's value as well as a comparison with similar homes in the area
Home Values in the Area
Average Home Value in this Area
Purchase History
| Date | Buyer | Sale Price | Title Company |
|---|---|---|---|
| Kondrat James W | -- | Attorney | |
| Kondrat James W | -- | Citywide Title Corporation | |
| Kondrat James W | $75,000 | Chicago Title | |
| Ritter Steven | $55,500 | Greater Illinois Title Compa |
Source: Public Records
Mortgage History
| Date | Status | Borrower | Loan Amount |
|---|---|---|---|
| Open | Kondrat James W | $257,427 | |
| Previous Owner | Ritter Steven | $40,539 |
Source: Public Records
Tax History Compared to Growth
Tax History
| Year | Tax Paid | Tax Assessment Tax Assessment Total Assessment is a certain percentage of the fair market value that is determined by local assessors to be the total taxable value of land and additions on the property. | Land | Improvement |
|---|---|---|---|---|
| 2024 | -- | $230,299 | $21,599 | $208,700 |
| 2023 | -- | $205,974 | $19,318 | $186,656 |
| 2022 | $0 | $199,362 | $37,290 | $162,072 |
| 2021 | $0 | $185,729 | $34,740 | $150,989 |
| 2020 | $0 | $179,154 | $33,510 | $145,644 |
| 2019 | $0 | $183,421 | $32,073 | $151,348 |
| 2018 | $0 | $169,442 | $29,629 | $139,813 |
| 2017 | $0 | $159,625 | $27,912 | $131,713 |
| 2016 | $0 | $149,714 | $26,179 | $123,535 |
| 2013 | -- | $133,655 | $24,422 | $109,233 |
Source: Public Records
Map
Nearby Homes
- 6504 Sands Rd
- 6102 Scott Ln
- 4010 Wyndwood Dr
- 4119 White Ash Rd
- Lot#34 White Ash Rd
- 5912 Prairie Ridge Rd
- 3814 Church Hill Ln
- 6201 N Wyndwood Dr
- 3717 Lindsay Ln
- 5805 Wild Plum Rd
- 6418 Carrie Ct
- 4717 Wallens Dr
- 3514 E Crystal Lake Ave
- 438 Golf View Dr
- 797 Silk Oak Ln Unit 797
- 6111 Pingree Rd
- 845 E Terra Cotta Ave
- 6123 S Kilkenny Dr
- 221 Mistwood Ln
- 5419 Rita Ave
- 4220 Belson Ln
- 4215 Belson Ln
- 6412 Sands Rd
- 4216 Belson Ln
- 4209 Belson Ln
- 6401 Sands Rd
- 6311 Sands Rd
- 6409 Sands Rd
- 4210 Belson Ln
- 4201 Steeple Run
- 6413 Sands Rd
- 6307 Sands Rd
- 4204 Meandering Way
- 6417 Sands Rd
- 6303 Sands Rd
- 4215 Steeple Run
- 4117 Steeple Run
- 6421 Sands Rd
- 6213 Sands Rd
- 4305 Steeple Run