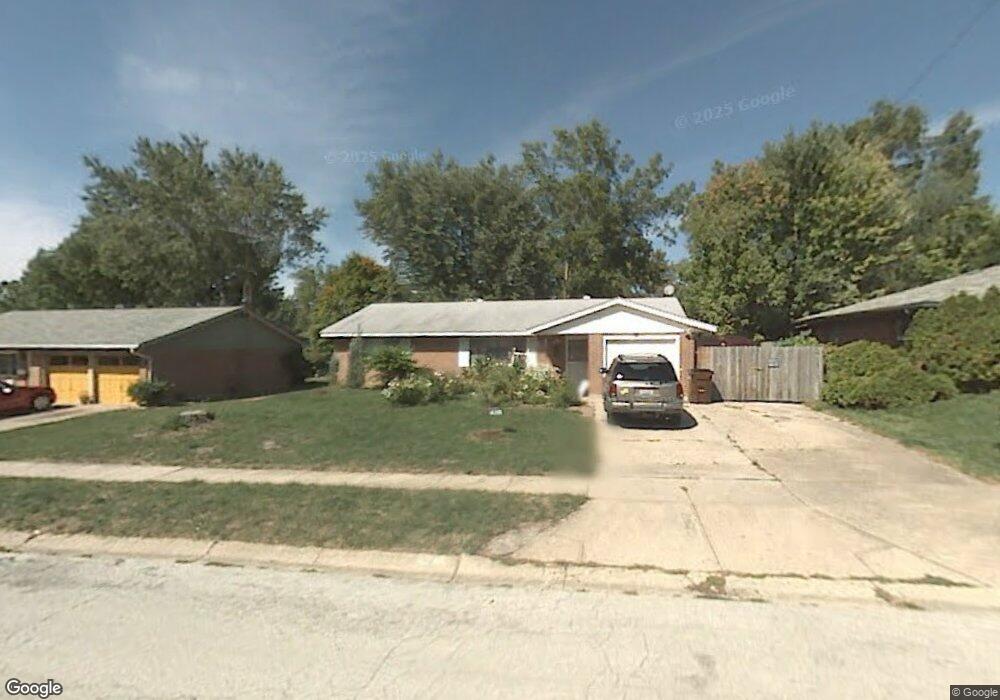
4219 Nevada Ave Dayton, OH 45416
Estimated Value: $72,000 - $121,000
3
Beds
2
Baths
1,183
Sq Ft
$80/Sq Ft
Est. Value
About This Home
This home is located at 4219 Nevada Ave, Dayton, OH 45416 and is currently estimated at $94,336, approximately $79 per square foot. 4219 Nevada Ave is a home located in Montgomery County with nearby schools including Valerie Elementary School, Imagine Klepinger Road Community School, and North Dayton School of Science & Discovery.
Ownership History
Date
Name
Owned For
Owner Type
Purchase Details
Closed on
Aug 26, 2024
Sold by
Nabors Enterprises Llc
Bought by
Evers Jason
Current Estimated Value
Home Financials for this Owner
Home Financials are based on the most recent Mortgage that was taken out on this home.
Original Mortgage
$40,000
Interest Rate
1%
Mortgage Type
Construction
Purchase Details
Closed on
Jul 12, 2024
Sold by
Butcher Marcus D and Butcher Malinda A
Bought by
Nabors Enterprises Llc
Home Financials for this Owner
Home Financials are based on the most recent Mortgage that was taken out on this home.
Original Mortgage
$40,000
Interest Rate
1%
Mortgage Type
Construction
Purchase Details
Closed on
Jan 26, 2009
Sold by
Estate Of Marcus Butcher
Bought by
Butcher Mary
Purchase Details
Closed on
Jun 9, 2008
Sold by
Estate Of Mary Lou Butcher
Bought by
Butcher Marcus Dwayne
Purchase Details
Closed on
Aug 16, 2002
Sold by
Butcher Marcus
Bought by
Butcher Mary Lou
Create a Home Valuation Report for This Property
The Home Valuation Report is an in-depth analysis detailing your home's value as well as a comparison with similar homes in the area
Home Values in the Area
Average Home Value in this Area
Purchase History
| Date | Buyer | Sale Price | Title Company |
|---|---|---|---|
| Evers Jason | $69,900 | None Listed On Document | |
| Nabors Enterprises Llc | $40,000 | None Listed On Document | |
| Butcher Mary | -- | None Available | |
| Butcher Marcus Dwayne | -- | None Available | |
| Butcher Mary Lou | -- | -- |
Source: Public Records
Mortgage History
| Date | Status | Borrower | Loan Amount |
|---|---|---|---|
| Previous Owner | Nabors Enterprises Llc | $40,000 |
Source: Public Records
Tax History Compared to Growth
Tax History
| Year | Tax Paid | Tax Assessment Tax Assessment Total Assessment is a certain percentage of the fair market value that is determined by local assessors to be the total taxable value of land and additions on the property. | Land | Improvement |
|---|---|---|---|---|
| 2024 | $1,287 | $20,520 | $3,210 | $17,310 |
| 2023 | $1,287 | $20,520 | $3,210 | $17,310 |
| 2022 | $1,465 | $17,350 | $2,720 | $14,630 |
| 2021 | $1,458 | $17,350 | $2,720 | $14,630 |
| 2020 | $1,454 | $17,350 | $2,720 | $14,630 |
| 2019 | $1,544 | $16,490 | $2,720 | $13,770 |
| 2018 | $1,546 | $16,490 | $2,720 | $13,770 |
| 2017 | $1,535 | $16,490 | $2,720 | $13,770 |
| 2016 | $746 | $16,490 | $2,720 | $13,770 |
| 2015 | $711 | $16,490 | $2,720 | $13,770 |
| 2014 | $711 | $16,490 | $2,720 | $13,770 |
| 2012 | -- | $17,580 | $3,680 | $13,900 |
Source: Public Records
Map
Nearby Homes
- 4237 Nevada Ave
- 4322 Annapolis Ave
- 4472 Curundu Ave
- 3678 Wilmore St
- 4235 Merryfield Ave
- 4131 Merryfield Ave
- 4180 Indian Ln
- 3462 Arlene Ave
- 3997 Mayview Dr
- 4104 Brenton Dr
- 4228 Molane St
- 4703 Natchez Ave
- 3713 El Paso Ave
- LOT#26 Glenbrook Dr
- Lot#1 Glenbrook Dr
- Lot#24 Glenbrook Dr
- Lot#21 Glenbrook Dr
- 4616 Channing Ln
- Lot#25 Glenbrook Dr
- 3732 Beckley Ave
- 4213 Nevada Ave
- 4225 Nevada Ave
- 4116 Annapolis Ave
- 4231 Nevada Ave
- 4207 Nevada Ave
- 4220 Nevada Ave
- 4118 Annapolis Ave
- 4214 Nevada Ave
- 4226 Nevada Ave
- 4104 Annapolis Ave
- 4132 Annapolis Ave
- 4208 Nevada Ave
- 4201 Nevada Ave
- 4232 Nevada Ave
- 4100 Annapolis Ave
- 3801 Jason Ave
- 4215 Curundu Ave
- 4238 Nevada Ave
- 4229 Curundu Ave
- 4140 Annapolis Ave