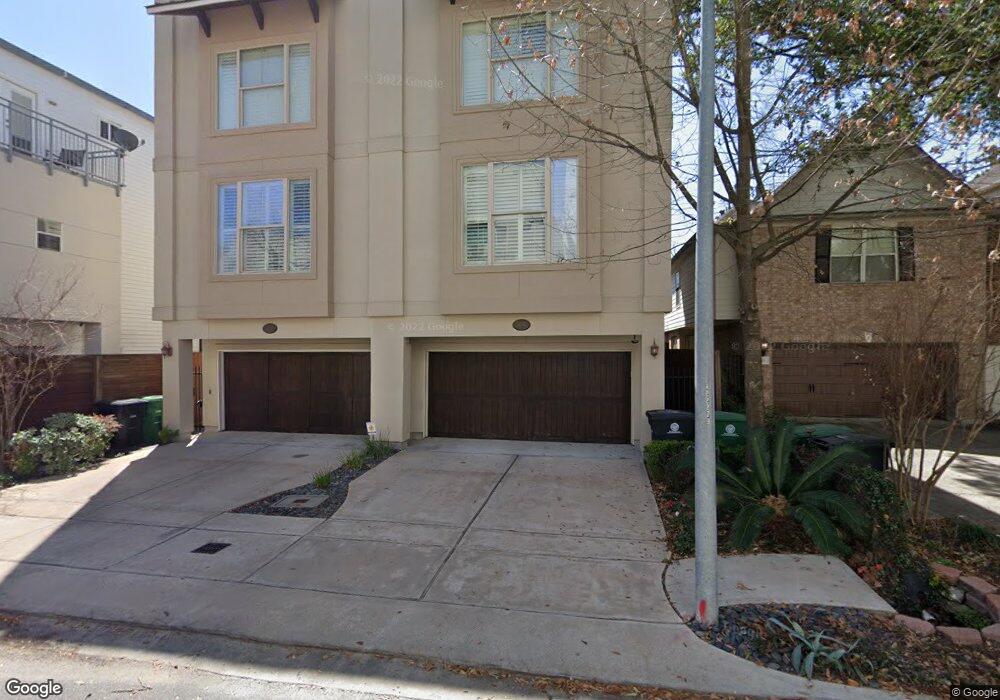
4219 Rose St Unit B Houston, TX 77007
Memorial Heights NeighborhoodEstimated Value: $431,370 - $530,000
3
Beds
3
Baths
2,047
Sq Ft
$231/Sq Ft
Est. Value
About This Home
This home is located at 4219 Rose St Unit B, Houston, TX 77007 and is currently estimated at $471,843, approximately $230 per square foot. 4219 Rose St Unit B is a home located in Harris County with nearby schools including Memorial Elementary School, Hogg Middle, and Heights High School.
Ownership History
Date
Name
Owned For
Owner Type
Purchase Details
Closed on
Jun 26, 2013
Sold by
Perez Susan D
Bought by
Sdc Properties Llc
Current Estimated Value
Purchase Details
Closed on
Jul 26, 2007
Sold by
Apex Builders Lp
Bought by
Bercon Ltd
Home Financials for this Owner
Home Financials are based on the most recent Mortgage that was taken out on this home.
Original Mortgage
$180,000
Interest Rate
6.71%
Mortgage Type
Purchase Money Mortgage
Purchase Details
Closed on
Sep 20, 2006
Sold by
Cook Marianne S
Bought by
Apex Builders Lp
Home Financials for this Owner
Home Financials are based on the most recent Mortgage that was taken out on this home.
Original Mortgage
$131,200
Interest Rate
6.51%
Mortgage Type
Purchase Money Mortgage
Purchase Details
Closed on
May 6, 1994
Sold by
Mckay Ralph C
Bought by
Cook Donald K
Create a Home Valuation Report for This Property
The Home Valuation Report is an in-depth analysis detailing your home's value as well as a comparison with similar homes in the area
Home Values in the Area
Average Home Value in this Area
Purchase History
| Date | Buyer | Sale Price | Title Company |
|---|---|---|---|
| Sdc Properties Llc | -- | None Available | |
| Bercon Ltd | -- | Charter Title Company | |
| Apex Builders Lp | -- | Startex Title Company | |
| Cook Donald K | -- | Stewart Title |
Source: Public Records
Mortgage History
| Date | Status | Borrower | Loan Amount |
|---|---|---|---|
| Previous Owner | Bercon Ltd | $180,000 | |
| Previous Owner | Apex Builders Lp | $131,200 |
Source: Public Records
Tax History Compared to Growth
Tax History
| Year | Tax Paid | Tax Assessment Tax Assessment Total Assessment is a certain percentage of the fair market value that is determined by local assessors to be the total taxable value of land and additions on the property. | Land | Improvement |
|---|---|---|---|---|
| 2025 | $9,611 | $489,565 | $235,235 | $254,330 |
| 2024 | $9,611 | $459,328 | $210,474 | $248,854 |
| 2023 | $9,611 | $464,530 | $210,474 | $254,056 |
| 2022 | $9,406 | $427,172 | $210,474 | $216,698 |
| 2021 | $9,109 | $390,848 | $210,474 | $180,374 |
| 2020 | $9,431 | $389,459 | $210,474 | $178,985 |
| 2019 | $9,866 | $389,886 | $210,474 | $179,412 |
| 2018 | $9,437 | $372,938 | $148,570 | $224,368 |
| 2017 | $9,942 | $393,195 | $148,570 | $244,625 |
| 2016 | $9,942 | $393,195 | $148,570 | $244,625 |
| 2015 | $9,564 | $393,195 | $148,570 | $244,625 |
| 2014 | $9,564 | $372,046 | $148,570 | $223,476 |
Source: Public Records
Map
Nearby Homes
- 815 Olive St
- 4215 Lillian St
- 818 Olive St Unit B
- 4309 Floyd St Unit B
- 4115 Barnes St
- 911, 913, 915 & 915 Thompson St
- 4404 Floyd St Unit C
- 4402 Lillian St Unit 8
- 4314 Gibson St Unit A
- 4314 Gibson St Unit B
- 908 Patterson St
- 806 Jackson Hill St Unit 203
- 904 Patterson St
- 918 Patterson St
- 4006 Barnes St
- 4229 Gibson St
- 4026 Blossom St
- 4024 Blossom St
- 1615 Holly St
- 4318 Center St
- 4219 Rose St Unit A
- 4219B Rose St
- 4219 Rose St
- 4219A Rose St
- 4221 Rose St
- 4223 Rose St
- 4217 Rose St
- 4217 Rose St
- 4217 Rose St Unit E
- 4217 Rose St Unit C
- 4217 Rose St Unit D
- 4217 Rose St
- 4217 Rose St Unit B
- 4217 Rose St Unit A
- 4217 E Rose
- 813 Olive St
- 811 Olive St
- 4306 Floyd St
- 803 Olive St
- 4308 Floyd St Unit A