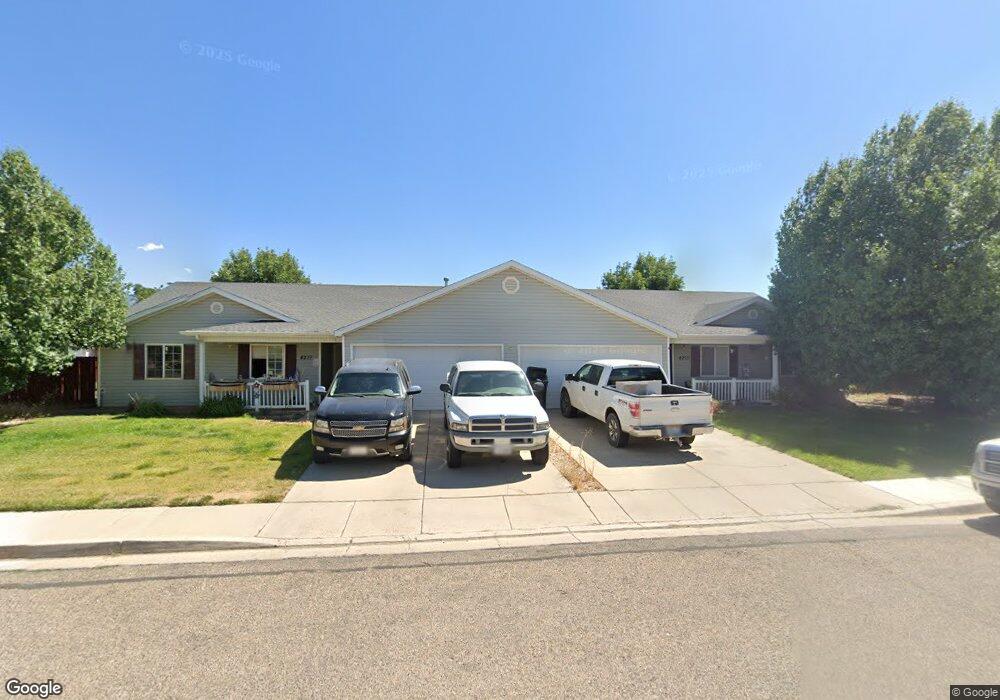
4219 W 200 N Cedar City, UT 84720
Estimated Value: $306,563 - $523,000
--
Bed
--
Bath
--
Sq Ft
7,405
Sq Ft Lot
About This Home
This home is located at 4219 W 200 N, Cedar City, UT 84720 and is currently estimated at $381,641. 4219 W 200 N is a home located in Iron County with nearby schools including Iron Springs School, Cedar Middle School, and Cedar City High School.
Ownership History
Date
Name
Owned For
Owner Type
Purchase Details
Closed on
Dec 5, 2005
Sold by
Mark I Development Llc
Bought by
Sakoda Darokh
Current Estimated Value
Home Financials for this Owner
Home Financials are based on the most recent Mortgage that was taken out on this home.
Original Mortgage
$121,410
Outstanding Balance
$59,083
Interest Rate
4.25%
Mortgage Type
Adjustable Rate Mortgage/ARM
Estimated Equity
$322,558
Purchase Details
Closed on
Nov 5, 2005
Sold by
Mark I Development Llc
Bought by
Sakoda Farokh
Home Financials for this Owner
Home Financials are based on the most recent Mortgage that was taken out on this home.
Original Mortgage
$121,410
Outstanding Balance
$59,083
Interest Rate
4.25%
Mortgage Type
Adjustable Rate Mortgage/ARM
Estimated Equity
$322,558
Create a Home Valuation Report for This Property
The Home Valuation Report is an in-depth analysis detailing your home's value as well as a comparison with similar homes in the area
Home Values in the Area
Average Home Value in this Area
Purchase History
| Date | Buyer | Sale Price | Title Company |
|---|---|---|---|
| Sakoda Darokh | -- | -- | |
| Sakoda Farokh | -- | -- |
Source: Public Records
Mortgage History
| Date | Status | Borrower | Loan Amount |
|---|---|---|---|
| Open | Sakoda Farokh | $121,410 |
Source: Public Records
Tax History Compared to Growth
Tax History
| Year | Tax Paid | Tax Assessment Tax Assessment Total Assessment is a certain percentage of the fair market value that is determined by local assessors to be the total taxable value of land and additions on the property. | Land | Improvement |
|---|---|---|---|---|
| 2025 | $1,157 | $148,772 | $8,250 | $140,522 |
| 2023 | $1,162 | $152,325 | $9,325 | $143,000 |
| 2022 | $1,390 | $151,250 | $8,250 | $143,000 |
| 2021 | $883 | $96,060 | $8,250 | $87,810 |
| 2020 | $996 | $96,060 | $8,250 | $87,810 |
| 2019 | $1,013 | $93,500 | $8,250 | $85,250 |
| 2018 | $983 | $87,725 | $8,250 | $79,475 |
| 2017 | $835 | $73,365 | $8,250 | $65,115 |
| 2016 | $860 | $70,400 | $6,875 | $63,525 |
| 2015 | $907 | $70,400 | $0 | $0 |
| 2014 | $909 | $66,000 | $0 | $0 |
Source: Public Records
Map
Nearby Homes