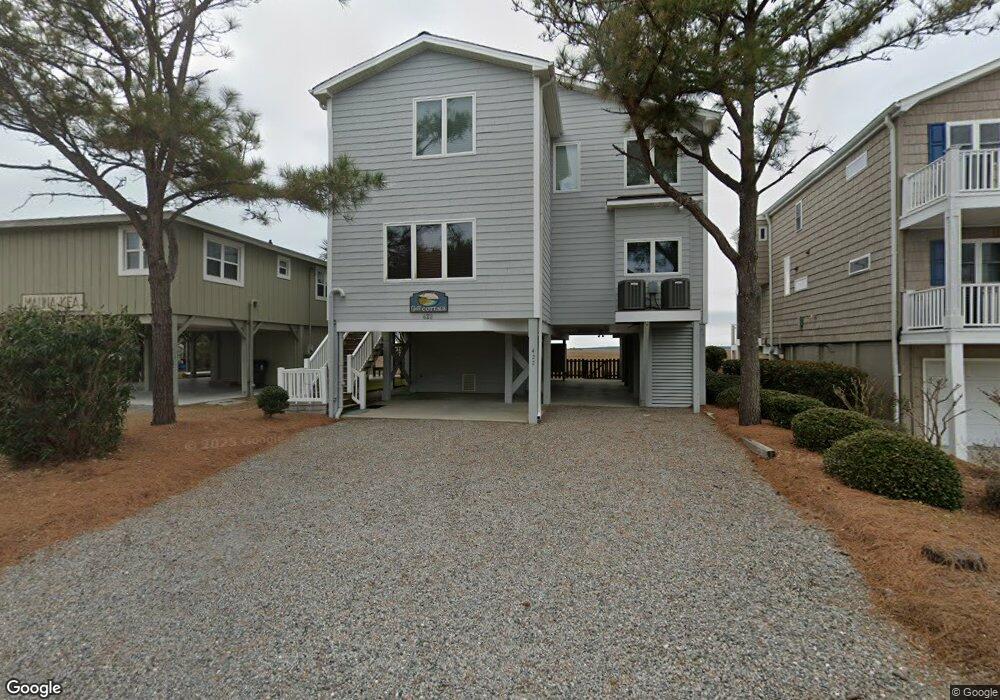
422 40th St Sunset Beach, NC 28468
Estimated Value: $1,267,000 - $1,543,000
3
Beds
4
Baths
2,501
Sq Ft
$573/Sq Ft
Est. Value
About This Home
This home is located at 422 40th St, Sunset Beach, NC 28468 and is currently estimated at $1,433,855, approximately $573 per square foot. 422 40th St is a home located in Brunswick County with nearby schools including Jessie Mae Monroe Elementary School, Shallotte Middle School, and West Brunswick High School.
Ownership History
Date
Name
Owned For
Owner Type
Purchase Details
Closed on
Feb 19, 2011
Sold by
Edwards Richard H and Edwards Deborah
Bought by
Walker David N and Walker Lynn
Current Estimated Value
Home Financials for this Owner
Home Financials are based on the most recent Mortgage that was taken out on this home.
Original Mortgage
$622,500
Outstanding Balance
$412,379
Interest Rate
4.12%
Mortgage Type
New Conventional
Estimated Equity
$1,021,476
Create a Home Valuation Report for This Property
The Home Valuation Report is an in-depth analysis detailing your home's value as well as a comparison with similar homes in the area
Home Values in the Area
Average Home Value in this Area
Purchase History
| Date | Buyer | Sale Price | Title Company |
|---|---|---|---|
| Walker David N | $870,000 | None Available |
Source: Public Records
Mortgage History
| Date | Status | Borrower | Loan Amount |
|---|---|---|---|
| Open | Walker David N | $622,500 |
Source: Public Records
Tax History Compared to Growth
Tax History
| Year | Tax Paid | Tax Assessment Tax Assessment Total Assessment is a certain percentage of the fair market value that is determined by local assessors to be the total taxable value of land and additions on the property. | Land | Improvement |
|---|---|---|---|---|
| 2025 | -- | $1,145,850 | $494,500 | $651,350 |
| 2024 | $6,352 | $1,145,850 | $494,500 | $651,350 |
| 2023 | $6,437 | $1,145,850 | $494,500 | $651,350 |
| 2022 | $0 | $909,520 | $406,250 | $503,270 |
| 2021 | $0 | $909,520 | $406,250 | $503,270 |
| 2020 | $5,683 | $909,520 | $406,250 | $503,270 |
| 2019 | $6,437 | $411,600 | $406,250 | $5,350 |
| 2018 | $5,761 | $409,260 | $406,250 | $3,010 |
| 2017 | $5,733 | $409,260 | $406,250 | $3,010 |
| 2016 | $5,683 | $409,260 | $406,250 | $3,010 |
| 2015 | $5,683 | $850,110 | $406,250 | $443,860 |
| 2014 | $4,252 | $740,026 | $472,500 | $267,526 |
Source: Public Records
Map
Nearby Homes